State of Disc Golf: Aces!
It won’t come as a surprise to anyone to hear that the people I know who play the most (or have been playing the longest) have the most hole-in-ones, or ‘aces’. Most of them can tell you exactly how many aces they have. Some retire and save their ace discs, while others continue to throw them, often times picking up multiple aces on the same disc. I frequently see pictures of found discs that have aces or multiple aces, so I know a lot of us continue to throw them. Others of us have few or no aces, always hoping to add a hole-in-one to our scorecards.
Because of the size of the target we are aiming for in disc golf, we get a lot more aces than our sister sport, ball golf. Even so, our first ace often takes years to accomplish. I talked to one disc golfer a few years ago who had a PDGA number that indicated he had been playing since the 80’s, yet he didn’t have a single ace! The often elusive ace is what we are going to be talking about in today’s installment of the State of Disc Golf 2022.
Did We Ace?
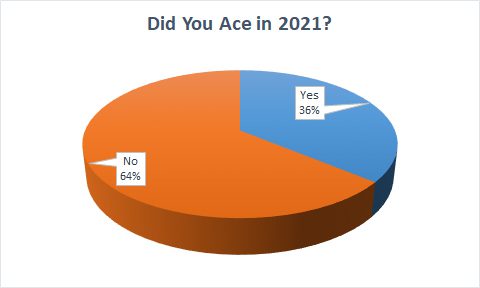
In our survey for last year, we asked a couple of questions about aces. First, we asked if you got an ace in 2021. Second, if you did get an ace, we asked how many aces you got. We’ll look at those answers, as well as a breaking down the aces by a few different demographics.
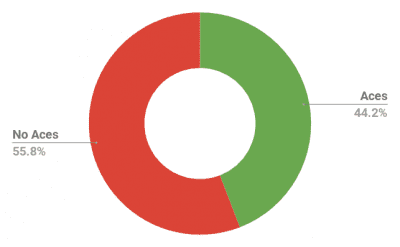
Checking out the survey results, we see that over a third of us indicated that we got an ace last year.
Multiple Aces
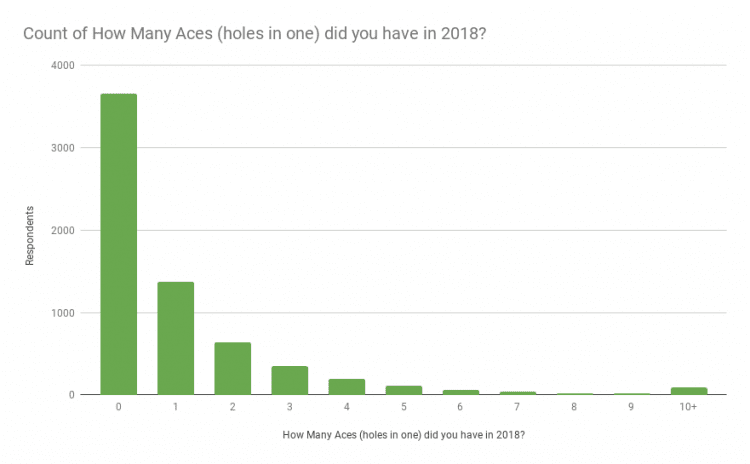
After we established how many of us got an ace, we asked those people how many aces they got last year. Which is kind of disgusting to those of us who didn’t get an ace. But, as painful as it might be, we wanted to know how many aces people got. It turns out that some of us get a lot!
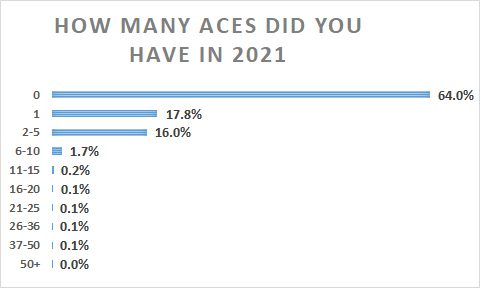
Almost all of the people who aced last year got five or less. But, there were quite a few who got between 6-20 aces. And there were a select few who averaged a couple aces per month! If you play a lot and have some short courses near you, it would certainly increase the odds of getting aces.
Play More, Ace More
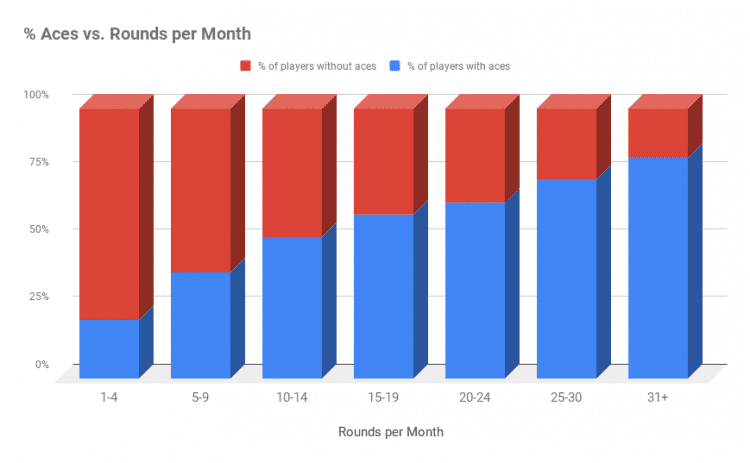
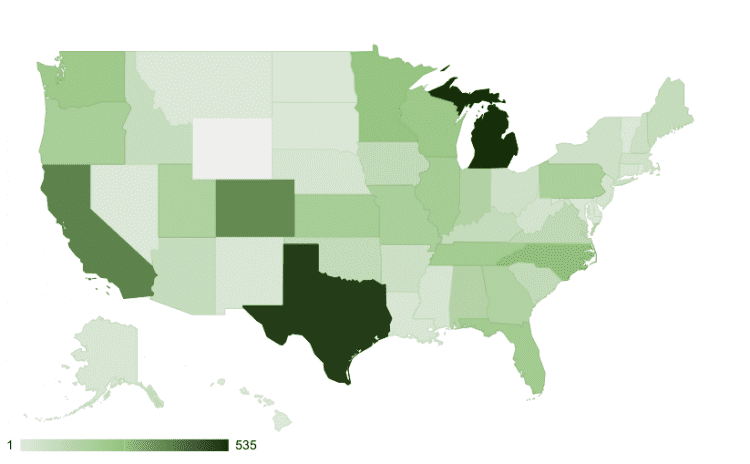
Speaking of playing a lot, I wanted to isolate the people who aced last year, and see how many rounds they played. Obviously, the more you play, the more opportunities you have to ace. I took the people who indicated that they aced last year, and sorted them by the number of rounds that they average each month. Since there were a range of the number of rounds played, I just took the low of 1-5 rounds, and the highest two ranges, 25-30 rounds and 30+ rounds. Here are the stats:
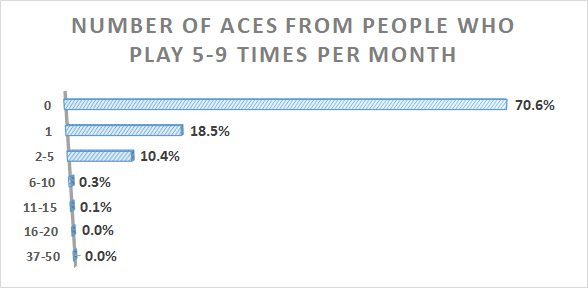
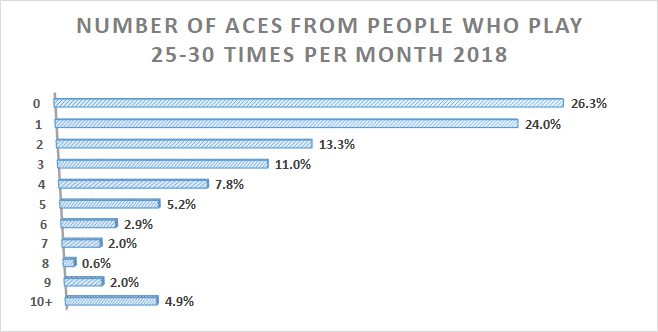
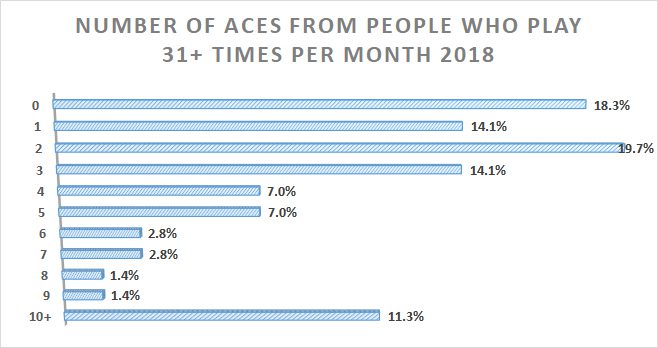
Want more aces? Play more rounds of disc golf!
Skillful Aces
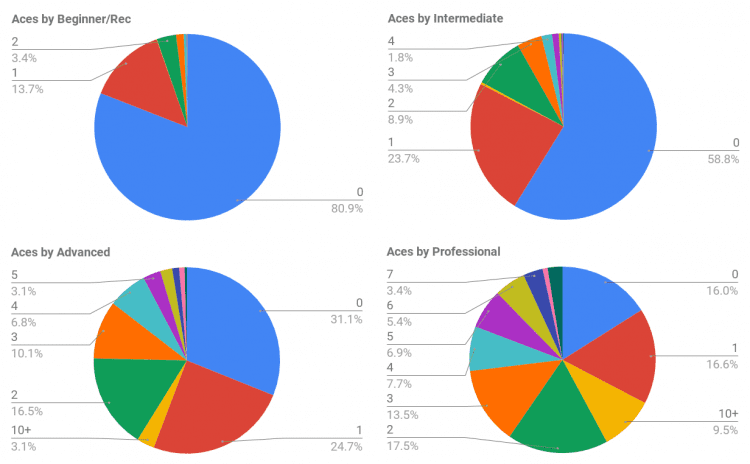
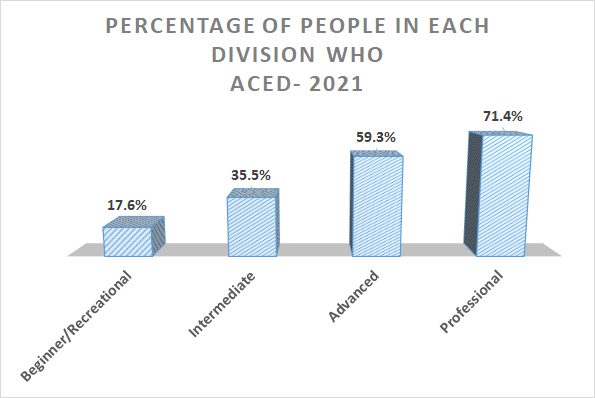
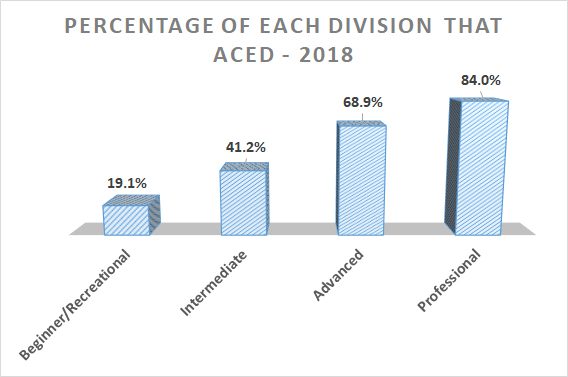
Another demographic I wanted to examine is the skill level of the people getting aces. Again, it is pretty obvious to predict that the higher the skill level, the more aces. The interesting part might be to look at how many more aces an average pro will get, versus an average beginner. Here is a chart showing the percentage of each skill level that got at least one ace.
Him, Her, Them
When it comes to a comparison between men and women, it is another example of knowing the results, but not knowing the margin of difference. Men can throw farther on average which gives them an advantage of being able to reach more holes, thus giving them more opportunities for aces. Here are the numbers:
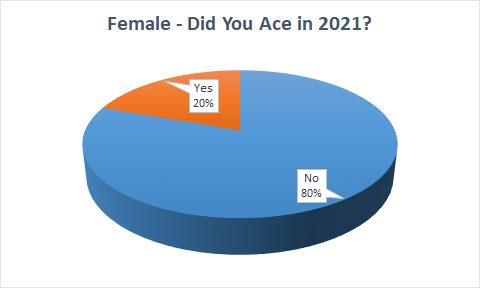
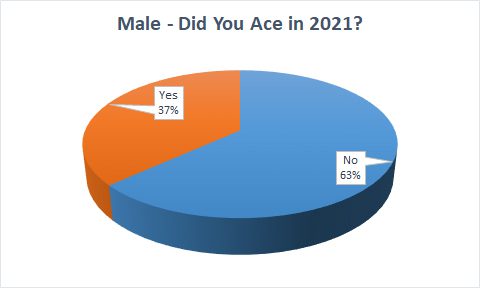
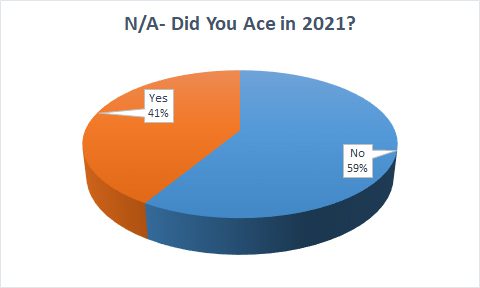
Around 20% of the women who took the survey got an ace. With the guys, over a third of them got an ace. The sample size for the men is significantly larger than for the women or N/A, so it is likely more accurate.
Past Ace Data
One last piece of ace-related data that I wanted to look at is to check with the results of the 2018 survey and compare the aces rate from then to now. My first thought is that there wouldn’t be a big change from year to year for the percentage of us who get an ace. Then I looked at the numbers:
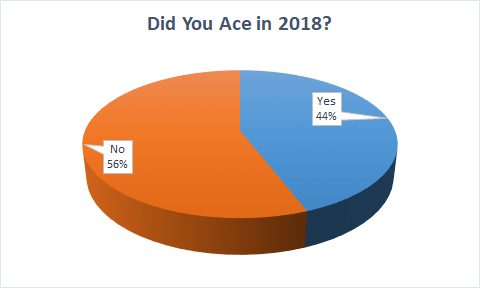
I was surprised to see a significant difference in the number of us that picked up an ace in 2018 over 2021. There were 44.2% of us that got an ace in 2018, but only 36% of us aced last year. To figure out why we dropped in numbers last year, I looked at some of the survey results shown above.
The first thing I looked at was the number of rounds played in 2018 to see if there were numbers that would point to something significant. It turns out that number of rounds played were done so at a nearly identical rate in 2018 and 2021. However, the percentage of people getting aces were lower in 2021 for every category of rounds played. That made me think that skill level was to blame.
Pandemic Affect
One of the byproducts of the pandemic was a huge influx of new disc golfers. The survey results affirmed that fact. Here is the breakdown by skill level of survey respondents in 2018 and 2021:
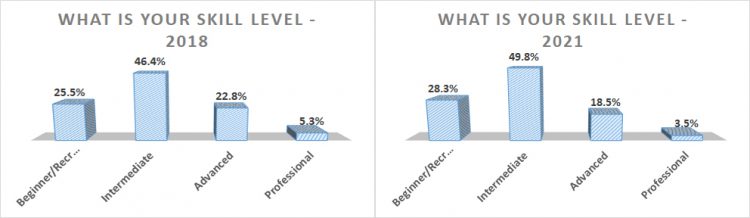
Clearly the upper divisions have shrunk slightly and the lower divisions have grown a bit. That seemed to validate my theory that we have a smaller ratio of people in the higher division, leading to a smaller ratio of people getting aces. However, when I looked at the percentage of aces in each division, each division is lower in 2021 than it was in 2018.
I still think the lower ace percentages are affected by the growth that came about because of Covid. I suspect there are more people in the sport which might lead to people moving up divisions earlier than they should. Perhaps next year’s Survey will shed more light on the lower ace numbers.
Check back next week for more survey results!