State of Disc Golf 2021
2021 State of Disc Golf
Another year has rolled around and once again we are pouring over the results of our annual State of Disc Golf survey to see what disc golf looks like for the past year. What an interesting year! We are really curious to see how the pandemic affected the results of the survey. Our sport is one that can be played while maintaining social distancing, or even played/practiced solo. That caused a lot of growth for disc golf. We anticipate many of the survey results will reflect both the growth and the limitations put upon the sport because of Covid19. With that in mind, let’s get to the results!
2021 Disc Golf Demographics
We’ll start by looking at who took the survey. Where do you live? What is your gender? How old and how skilled are you? Basic demographics.
This year, 6,286 people took the survey. That is down a few hundred compared to the last couple of years. Here is a breakdown of the respondent’s genders.
Gender
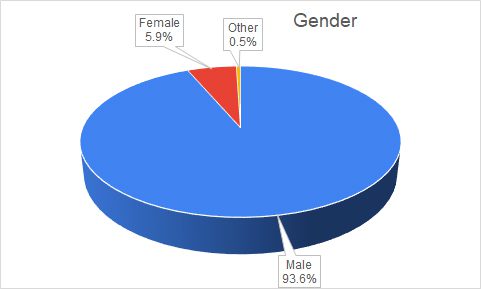
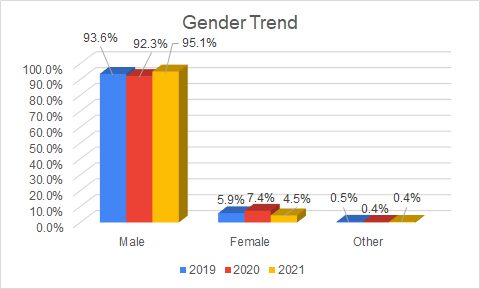
Checking out the last few years of data, we see that the numbers are relatively consistent. Last year we did a last minute push to get more women to take the survey, so there was a small ‘spike’ in the numbers. But, the overall numbers for women in the sport remain a lot lower than most of us think it should be. In our local club, we only have a couple female players that will show up for leagues. There are quite a few wives/girlfriends of club members that play disc golf. They just don’t have a desire to play at leagues or competitively. Here are the last few years in a graph:
Where Do You Live?
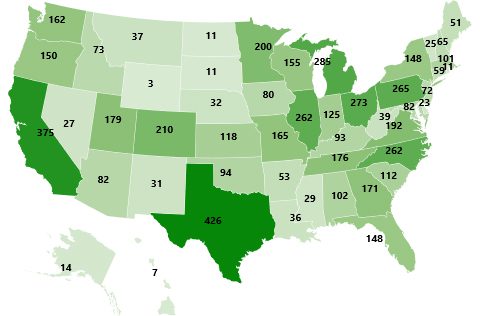
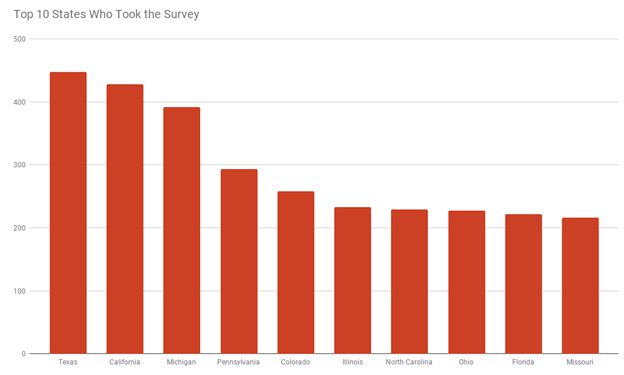
Not surprisingly, an overwhelming number of people who took the survey live in the United States. Looking at the numbers for each state, we see Texas and California leading the country with the highest number of disc golfers that took the survey. Given their populations and their climates, it’s easy to see why they have so many. They don’t have the highest number per capita, but we’ll have to explore that information in another blog. Here are the numbers for each state.
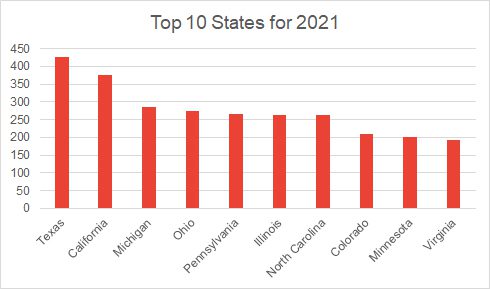
Here are the top ten states, along with the top ten from two years ago:
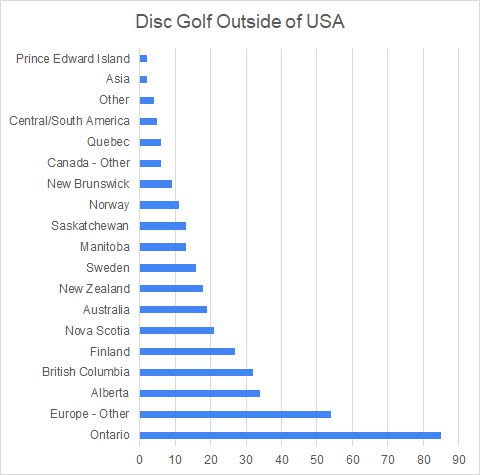
Our sport is global, and so are our customers. Here is a chart that shows the numbers of respondents from each country/region outside of the USA. If without adding up all of the provinces in Canada, they lead the world in the number of people that responded to the survey.
How Old Are You?
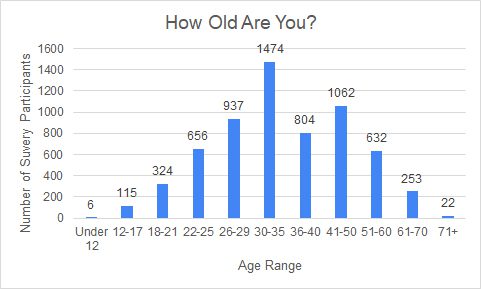
Checking the survey results for the ages of people who took the survey, we find the largest number of people in the 30-35 age bracket are once the most popular age bracket. That has been the case in all of our survey results in the past. One thing you’ll see is the 36-40 age bracket dip down, only to shoot back up in the next age group. That is because the age brackets go from 5-year increments to 10-year increments at that point.
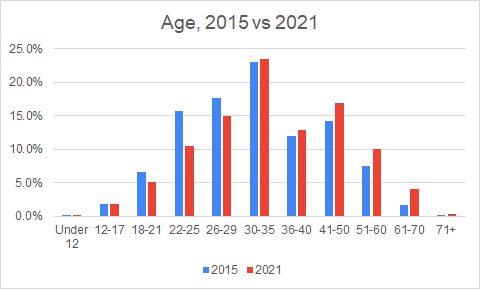
I checked out the 2015 survey results (here) to compare numbers and see if there are many differences in the age brackets between the two years. Here is a chart with both years’ data expressed in percentages of people who took the survey that year. I like that the older groups are trending upward for 2021, meaning people are playing later in life. I know that the younger age groups are the same or decreasing in percentage, but I don’t think that is a general trend in the sport. We’ll look at some other statistics that might help us understand those numbers better, and see why the older age groups are growing faster.
Are We Getting Better?
One of the questions we like to ask is how we rank our skills as a disc golfer. One way to come up with an answer is to look at what division we play in most of the time. That can vary, depending on how many tournaments we play. Often times playing in one division at a club league doesn’t mean we will play in the same division at a sanctioned tournament. From what I see, the level of competition is higher at a tournament, and it becomes necessary to play in a lower division. Not as a sandbagger, but as someone who couldn’t be competitive unless they play down. Once you move up to the pro ranks that is less of an issue. But for the rest of us, we might play a different division out of necessity. Even so, I feel like we have a good idea how we rank generally, and that is what we hope to find out with the survey. We asked people to rate their skills by choosing which of four divisions they consider themselves:
Beginner/Recreational, Intermediate, Advanced, or Professional
First, let’s look at this year’s results. Typical of past years, the majority of the respondents consider themselves Intermediate players. Here are the numbers:
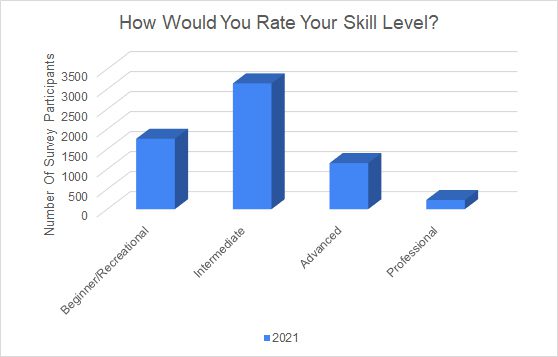
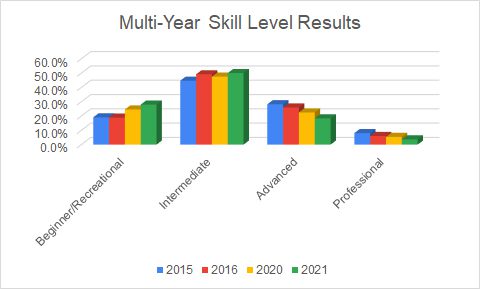
We also took a look at a few previous years to see how we ranked ourselves. Interestingly, there is a declining number of people that thought they were Advanced and Professional players. I don’t know yet if there were more people new to the sport, people are judging themselves more accurately, or players are dropping divisions. Either way, here is a graph of survey results for 2015, 2016, 2020, 2021.
Check Back For More Survey Results
Check out our blog next week to find out more survey results. Also, let us know what you would like us to ask in next year’s blog.
Ted Hegemann
Ted is the Chief Writer at Infinite Discs. He is responsible for the State of Disc Golf Survey articles and most of the "best discs" posts. Ted runs all kinds of local disc golf leagues and tournaments and tournaments in Northern Utah.
Missing the graph of survey results for 2015, 2016, 2020, 2021.
Thanks for the heads up. Corrected.
Perhaps this is an indication of all the newer people getting into the sport. Maybe these #’s will start to go up in the next couple years as players progress.
Waw.. great information. I didn’t think before reading this article about disc golf. Thanks for sharing it.
I think over time as dg media coverage goes from strength to strength, it’s becoming clearer to the average player how comparatively terrible they are.
Cool information. Thanks. Since the majority is Amateur, there should be more sponsors like DoubleGJerky.com that are willing to pay out the players in product.
Cool to see so many players in Ohio respond. I’ve definitely noticed an uptick in players over the past year just at my local courses, even during winter.
Agree on Ohio. Visibly more players on every course.
Possible to publish state participation data based on per capita?
I’ll make a note of your idea and see what I can do in an upcoming blog. Thanks!