State of Disc Golf: Demographics
2022 State Of Disc Golf
We’re back for another look at the State of Disc Golf as we start the tournament season for 2022. Just like last year, our world and our sport is being affected by the global pandemic. While it appears society is looking more ‘pre-pandemic’ than last year, we are still dealing with its effects on the supply chain. Many molds and products are still not available. But, while we can’t control what is available to sell, we can still look at the world of disc golf and analyze the data to see how disc golf looks this year, and how it has changed over the years that Infinite has been running the survey.
Age, State, and Gender
This year we had over 7650 people take the survey. We’ll take a look at a variety of answers every week for the next couple of months to learn more about our sport and the people who play it. We’ll start with some basic demographics, looking at our age, where we live, and our gender. Let’s start with our ages.
Aging Divisions
One thing that I’m always curious to see when looking at the results of the survey is how the numbers compare to what I see in the disc golfers in our region. Our local club is small and it seems like the demographics are pretty close to how it looked when I started playing regularly about 10 years ago. But, we see other clubs at tournaments so it is still possible to get a large sample size.
What I see happening in the tournament scene is that the 40-plus divisions are getting bigger. That is encouraging to see because it means more people are continuing to play as they age. We are still getting young players take up the sport, which is great for the future of disc golf. But, the older divisions are growing. Let’s see how that compares to the survey results.
Below is a graph of the results of the question, ‘How old are you?’
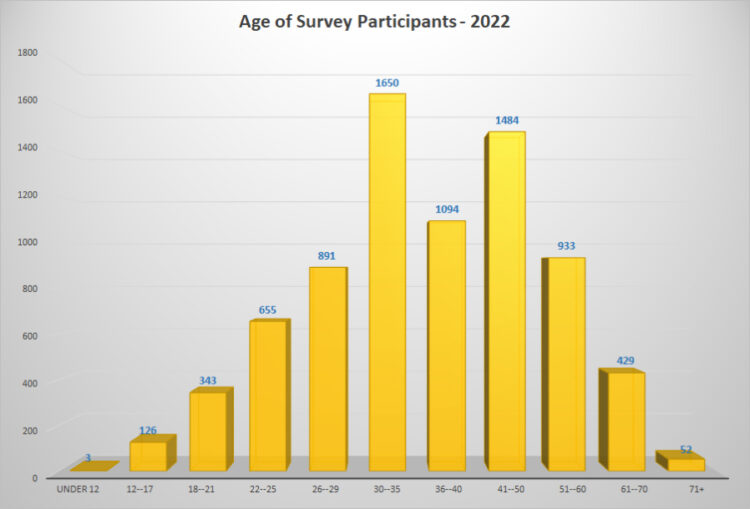
We’ve seen the basic shape of the graph in previous surveys. The 30-35-year-old group is the largest, then a drop in the 36-40 group, followed by a spike in the 41-50 group. The 41-50 group is the first group that includes 10 years. In looking at previous years’ results, however, we see a sharper drop after the 30-35 group. We’ll look at a couple different years, and to compare them equally we will look at the percentage of respondents in each group, rather than the total number. Here are the graphs from previous surveys.
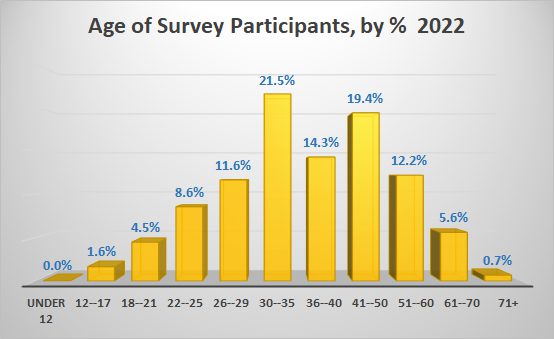
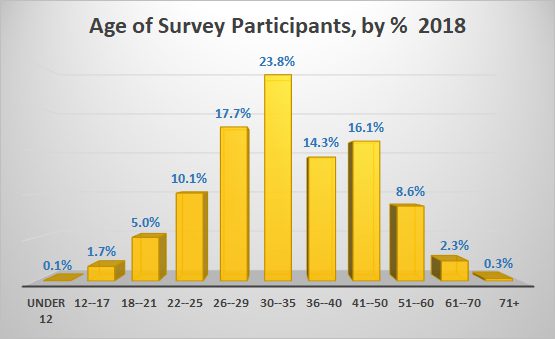

It’s good to see the growing size of the older groups. We’ll look at other survey questions to find out more about them and their disc golf world.
Where We Are From
The sport of disc golf is played in countries all around the world. We have seen non-US players battle it out with the top US pros on top-tier tournaments, and pick up wins. Recently, Estonian FPO player Kristin Tattar make headlines with her lucrative contract with Latitude 64. There is no doubt that disc golf is a global sport. There is also no doubt that the United States still has the largest number of disc golfers, and the survey showed that. Not surprisingly, the largest number of disc golfers are in the states with the biggest population. The states in the top ten will exchange positions from year to year. But it’s tough to find more disc golfers if your home state doesn’t boast the sheer number of people in other states. Here is the leader board for this year.
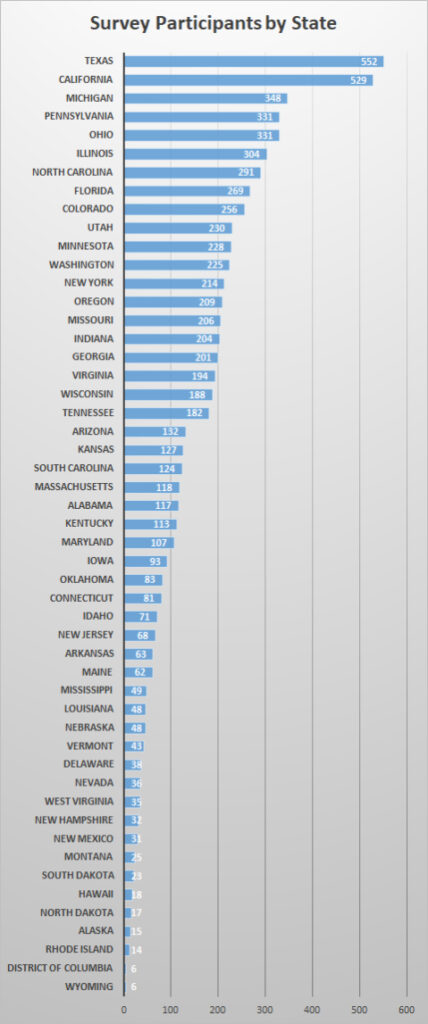
I was curious to see the ratio of disc golfers were in every state, so I got the population numbers from World Population Review website to find out. I divided the number of survey participants for each state into the population of that state. Here are the results:
| State | # Survey Participants | 2022 population | DG Density 1:x |
| Vermont | 43 | 622,882 | 14,486 |
| Utah | 230 | 3,363,182 | 14,623 |
| Oregon | 209 | 4,325,290 | 20,695 |
| Maine | 62 | 1,359,677 | 21,930 |
| Kansas | 127 | 2,919,179 | 22,986 |
| Colorado | 256 | 5,961,083 | 23,285 |
| Minnesota | 228 | 5,739,781 | 25,174 |
| Delaware | 38 | 998,619 | 26,279 |
| Idaho | 71 | 1,896,652 | 26,713 |
| Michigan | 348 | 9,995,212 | 28,722 |
| Missouri | 206 | 6,184,843 | 30,024 |
| Wisconsin | 188 | 5,867,518 | 31,210 |
| Indiana | 204 | 6,842,385 | 33,541 |
| Iowa | 93 | 3,174,426 | 34,134 |
| Washington | 225 | 7,887,965 | 35,058 |
| Ohio | 331 | 11,727,377 | 35,430 |
| North Carolina | 291 | 10,807,491 | 37,139 |
| Tennessee | 182 | 7,001,803 | 38,471 |
| Pennsylvania | 331 | 12,805,190 | 38,686 |
| South Dakota | 23 | 902,542 | 39,241 |
| Kentucky | 113 | 4,487,233 | 39,710 |
| Nebraska | 48 | 1,960,790 | 40,850 |
| Illinois | 304 | 12,518,071 | 41,178 |
| Alabama | 117 | 4,949,697 | 42,305 |
| New Hampshire | 32 | 1,378,449 | 43,077 |
| South Carolina | 124 | 5,342,388 | 43,084 |
| Montana | 25 | 1,093,117 | 43,725 |
| Connecticut | 81 | 3,546,588 | 43,785 |
| Virginia | 194 | 8,638,218 | 44,527 |
| North Dakota | 17 | 774,008 | 45,530 |
| Alaska | 15 | 720,763 | 48,051 |
| Oklahoma | 83 | 4,007,179 | 48,279 |
| Arkansas | 63 | 3,042,017 | 48,286 |
| West Virginia | 35 | 1,755,715 | 50,163 |
| Georgia | 201 | 10,936,299 | 54,409 |
| Texas | 552 | 30,097,526 | 54,525 |
| Maryland | 107 | 6,075,314 | 56,779 |
| Arizona | 132 | 7,640,796 | 57,885 |
| Massachusetts | 118 | 6,922,107 | 58,662 |
| Mississippi | 49 | 2,961,536 | 60,440 |
| New Mexico | 31 | 2,109,093 | 68,035 |
| California | 529 | 39,664,128 | 74,979 |
| Rhode Island | 14 | 1,062,583 | 75,899 |
| Hawaii | 18 | 1,401,709 | 77,873 |
| Florida | 269 | 22,177,997 | 82,446 |
| New York | 214 | 19,223,191 | 89,828 |
| Nevada | 36 | 3,238,601 | 89,961 |
| Louisiana | 48 | 4,616,106 | 96,169 |
| Wyoming | 6 | 582,233 | 97,039 |
| District of Columbia | 6 | 718,355 | 119,726 |
| New Jersey | 68 | 8,870,685 | 130,451 |
The state of Vermont has one disc golfer who took the survey for every 14.4k people. Utah is in second place, but that likely has a lot to do with Infinite’s headquarters being in Utah. California, which routinely has among the highest number of people who take the survey, is near the bottom of this list.
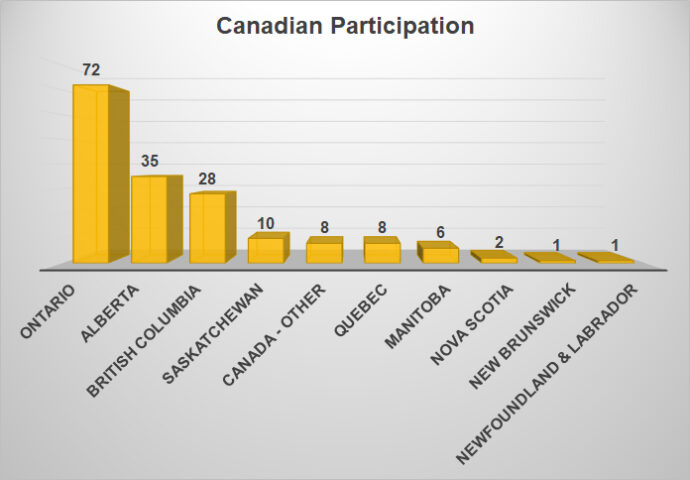
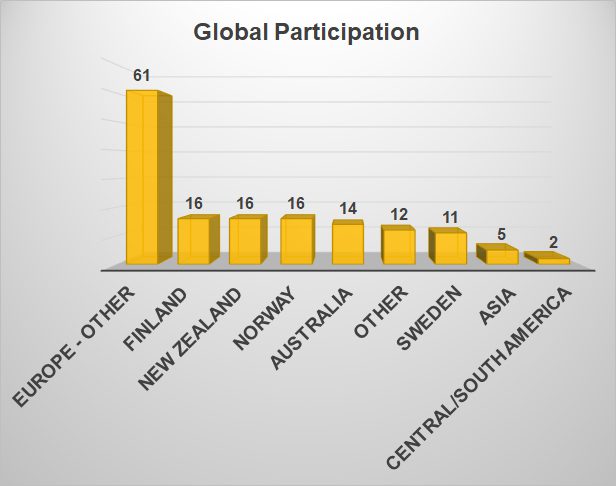
Infinite has customers around the world and many of them participate in the survey every year. For Canada, we broke the numbers down by province. For the rest of the world, we had participants select the region of the world they live in. Here are the results:
Gender
When it comes to the part of the survey that asks about gender, there is never really a question of which gender will have the highest number. But I am always interested to see if there is growth in the number of women taking the survey. Presumably that would mean a growth in the number of women in our sport. With so many of the top women disc golfers signing contracts that they are excited about, and with so much exposure in terms of tournament coverage, we certainly seems poised to grow the women’s side of disc golf. Things like last year’s FPO World Championship, which was every bit as exciting as the MPO Championship, should add a little more fuel to the fire of growth.
We’ll look at the results from past surveys and compare those to the most recent survey.
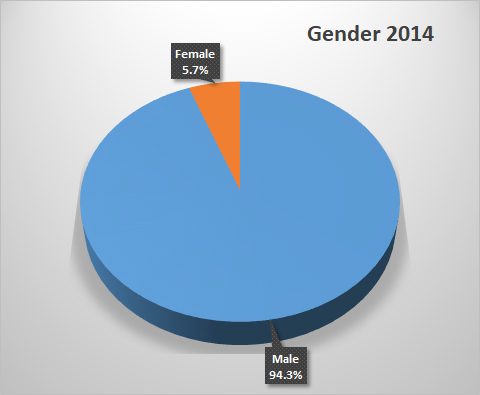
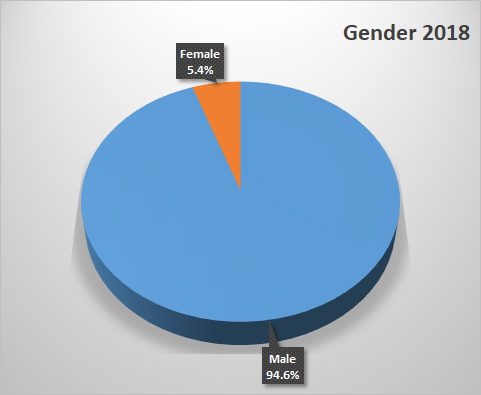
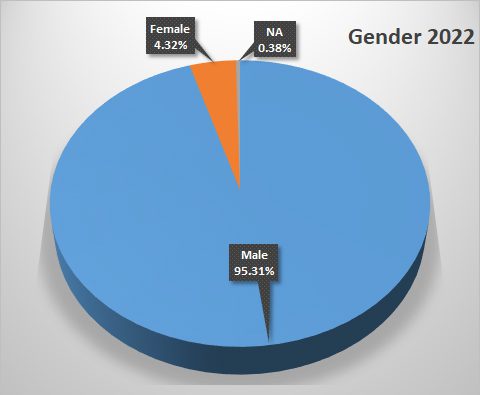
Although the data shows a slight drop in the percentage of women vs men taking the survey, the raw numbers are slightly up. In 2014, 286 women took the survey. In 2020, there were 330 women who took the survey. I would hope that the percentages would at lease stay the same as the number of disc golfers rises.
The PDGA shows fairly steady ratios between men and women between 2014 and 2020. Considering the explosion of growth in disc golf, that means that at least the number of women disc golfers who take the sport seriously enough to join the PDGA is rising. As we explore the rest of the SoDG survey, we might find data that will shed more light on the subject of women in disc golf.
In the previous two surveys mentioned in the charts above, we only had two choices for gender. That is why in this year’s survey there is the third option. We wanted to have an option for those who don’t identify with the binary choices.

Is the PDGA’s database from tournament participation available to you? It would show the home state of participants.
From that data we could see how many people from each state participated in 2022 tournaments. Then factor state population to gauge tournament participation per 10,000 state citizens.
That may show an interesting correlation to your approach of gauging state participation by survey respondents.