State of Disc Golf 2017 Results – Who Took the Survey?
The time has come to start taking a look at some of the data from the 2017 State of Disc Golf Survey. The data will be analyzed and shared over the course of the next few months. By way of introduction, let’s break down the demographics of who participated in the survey.
With nearly 10,000 disc golf players surveyed, this year provided, by far, the largest pool of individuals that we’ve surveyed since beginning the annual State of Disc Golf survey. That level of participation really helps us to gather some very pertinent information and helps give a realistic snapshot of the disc golf market. However, when looking at results, we do have to realize that people who participate in this kind of survey are people who are passionate enough about the sport to take a few minutes of their time to share their opinions. In our estimation, there are a good number of casual players who do not participate in such surveys. Those more casual players may not be entirely represented in the results.
Male vs Female Survey Participants
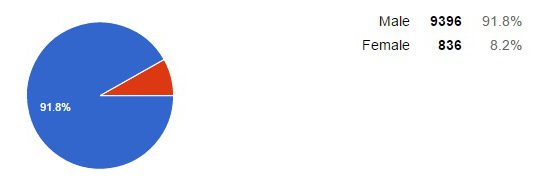 Of those surveyed, a whopping 91.8% were male, leaving only 8.2% as female. Does that truly reflect the balance of men vs. women in the game of disc golf? Though it might actually be a fairly accurate representation, we can surmise that simply less women are passionate enough about the game to take a survey (as mentioned above). But it would probably be an accurate statement to say that among passionate disc golfers, only 1 out of every 10 is a woman.
Age of Survey Participants
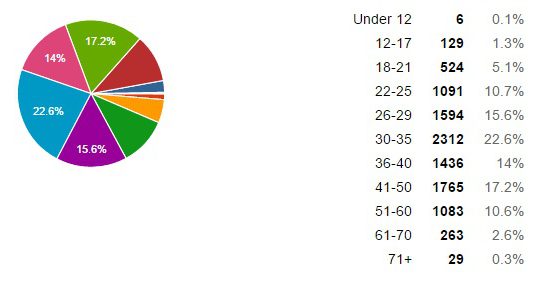 Looking at the age of those surveyed, we were happy to see a very wide spread. Though the age group that participated the most was the 30-35 demographic with 22.6%, other age groups ranging from 18 all the way through 60 were quite well represented. For those of us inside the disc golf industry, that is a very healthy statistic– to see that passionate players exist within all age groups. There is ground to be gained in the 17-and-lower age group, but that again could be an example of a group of people who are not interested in taking online surveys.
Disc Golfers Married vs Single
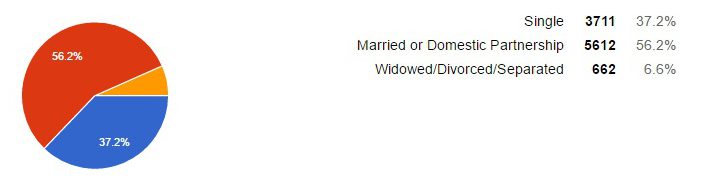 The majority of those who took the survey are married, with just more than half, at 56.2%. Single came in at 37.2%, and the widowed / divorced / separated group came in at 6.6%. By the way, as of 2015, roughly 55% of all Americans over the age of 18 were married, so the players surveyed fall pretty much within the national average.
The Employment Status of Those Surveyed
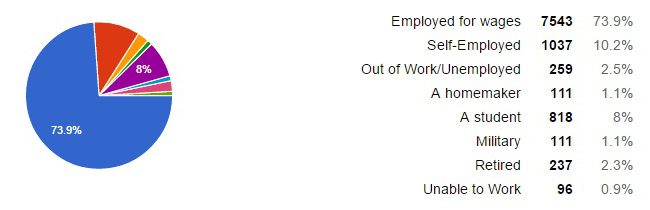 When looking at the employment status of those surveyed, the vast majority are employed for wages, with a few being self-employed. There is a sizable group of students that took the survey, but thankfully, not too many are unemployed or unable to work.
So, why do we ask these basic questions in a disc golf survey? Though things like gender, age, marriage status, and employment be only be marginally interesting statistics on their own, we use this data help determine other factors which are more pertinent to the growth of the disc golf scene. For example, it might be interesting to see how marital status factors into disc golf practice time. Do married players get less putting practice and field work? Do single players play in more tournaments? Does the job situation or marriage situation factor into the amount that players spend on disc golf? Does the age factor into tournament participation or willingness to travel for the game? Once we start looking at some of the more interesting survey data, and then break it into categories based on these introductory questions, it becomes even more revealing. That is the kind of data we’ll start looking at in future weekly State of Disc Golf 2017 blog posts, so stay tuned!
Fantastic read Todd! Thanks for the analysis and opportunity to be a part.
new guy in the block!….love it,just takes lots of practice!……thank goodness for utube!!