State of Disc Golf Survey: Demographics

Once again it is time to check out the results of the Infinite Discs State of Disc Golf survey. We had fewer surveys taken this year versus last year, but we still had 6536 people take the survey. I always look forward to seeing some of the results, which are a snapshot of the current state of disc golf. It’s also fun and interesting to compare this year’s results with prior years. Let’s check out the results.
Demographics
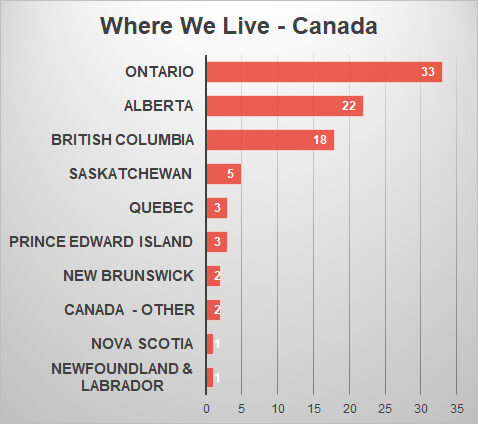
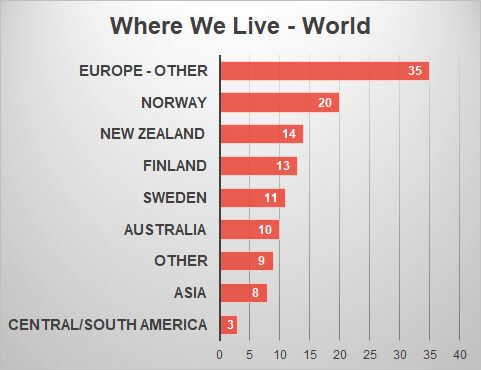
Every year we ask people about their basic demographics. We asked where people live, their age, and their gender. We’ll start with where we live. In the survey we gave people the option to select any of the 50 US states plus the District of Columbia, Canadian Providences, Australia, New Zealand, many countries in Europe, and several regions around the world. Hopefully, through the work of the McBeth foundation, in the future we will need to include all countries in Africa, Central and South America.
Where We Live
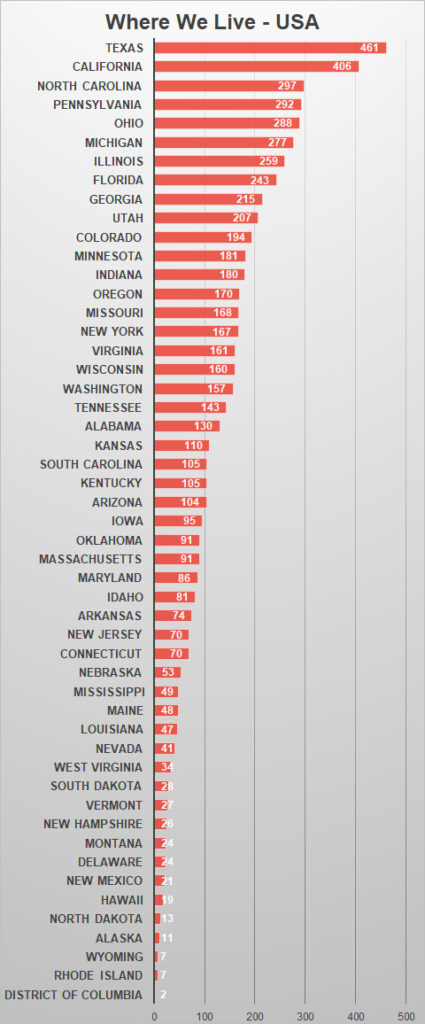
You probably won’t be surprised to learn that the states with the most survey participants are also the most populated. However, after the top two, the survey doesn’t match the list of the most populated states. Here is a chart of survey respondents according to where you indicated that you live:
Historically, the states with the highest number of respondents will vary slightly from year to year. As mentioned above, the most populated states are typically in the top of the results. But, that doesn’t tell us the per capita results. So, I took the survey results and compared them to the state population to see which state had the highest participation rate. Again, the state in the number one spot won’t be much of a surprise. In the chart the number by the state indicates how many people are in the state for every person who took the survey. Here is the chart:
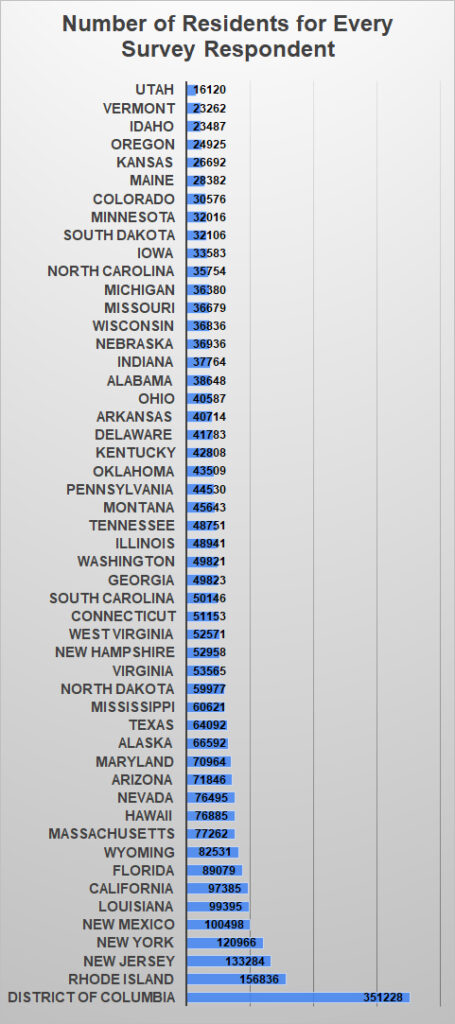
The home state for Infinite Discs is Utah, so it’s easy to see why we had the most participation per capita. Third place Idaho is right next door to Utah, and even has an Infinite store. Sandwiched between those two states is Vermont. With its sparse population, it doesn’t take a lot of people who took the survey to make them move up the chart. Oregon and Kansas have much bigger populations, and also good survey participation.
At the other end of the spectrum, Rhode Island and Washington, DC had the least participation per capita. Out of curiosity, I looked up both of those states’ PDGA membership. DC has 128 members (current and expired), while Rhode Island has 300. Utah, at the top of the per capita chart, has 2210 PDGA members.
Our Age
We did something with this survey that we should have done a long time ago: we cleaned up the age ranges that you could select. For example, instead of indicating whether you are 18-21, 22-25, 26-29, etc., we asked in 5-year increments. So, 20-24, 25-29, 30-34, Etc. While I like the 5-year blocks, it makes it tougher to compare this year’s results to previous years. But, we’ll do what we can. Here are the results of this year’s survey:
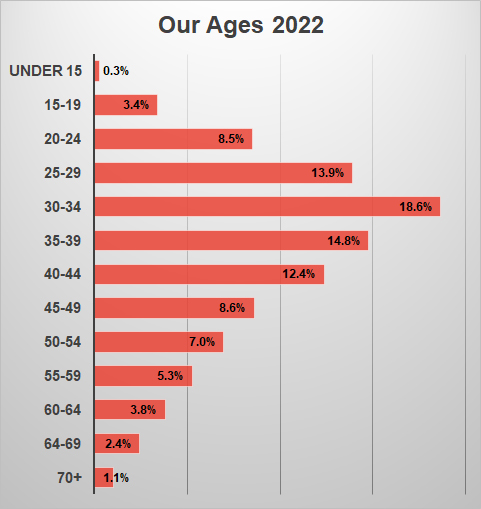
The resulting graph looks generally similar to results we’ve seen in the past. The numbers slowly climb as we approach 30, then slowly decline as we age past 35. Nearly a fifth of us fall in that 30-34 group that is the largest. That is close to the same number of all players 50+.
Let’s look at a couple of previous years’ results so we can see where the numbers might have changed.
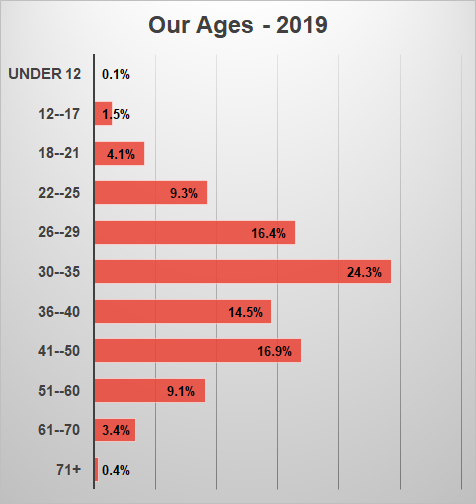
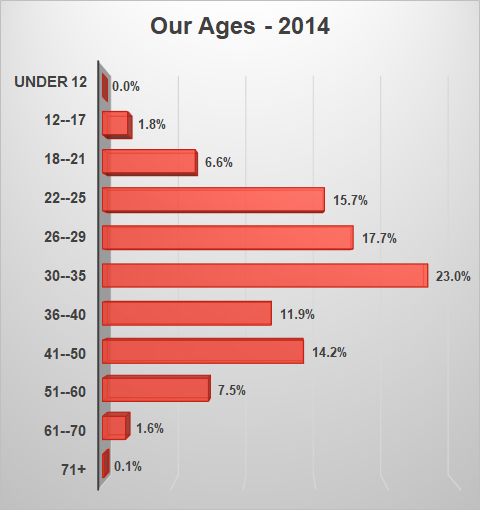
It looks like the age group that is consistently the highest is the 30-35 ish range. This year, however, that age group gave up some numbers to those of us who are younger and older. Let’s look at the under-30 group, the 30-39 group, and the 40+ group.
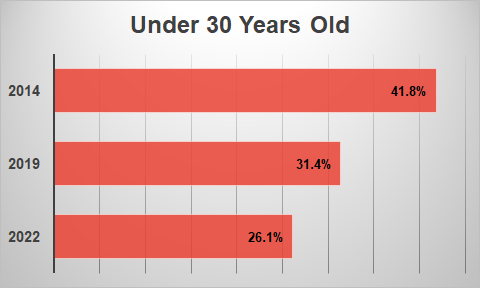
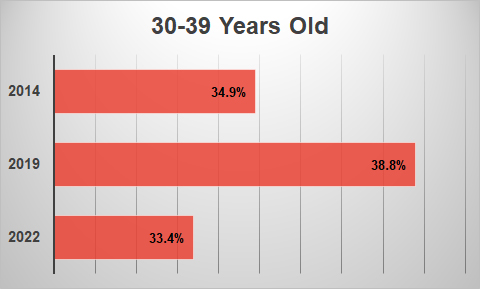
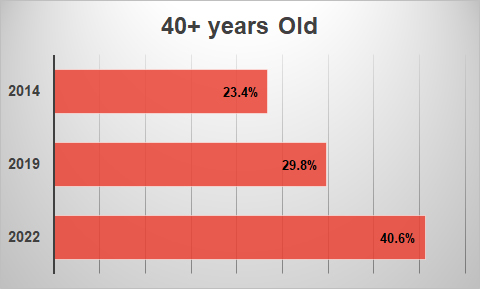
The survey results for the 40+ age group reflect what I see in tournaments in the area. The age-protected divisions are growing rapidly. As someone who plays in that group, that news is very encouraging. Hopefully that trend doesn’t stop, which will allow current young players to have a lengthy disc golf career.
It’s also encouraging to see younger players in the area, and see their numbers continue to grow. Despite the stats in the survey, we are doing pretty well as a sport. The future looks great and disc golf should continue to grow and expand. It really helps to have some of the young pros that the youth in disc golf can look up to and aspire to be.
Gender
When it comes to gender in the sport of disc golf, the numbers are probably always going to lean massively toward the guys. That’s what we see with the pros, and at most tournaments. Even so, FPO players are seeing the same relative increase in the number of competitors who are considered top tier. That is exciting for those of us who are fans of the pros and watching competitions. And beneficial to disc golf. We’ve already seen some great FPO tournament finishes this year, and with the number of top players increasing, we’re sure to see more. Let’s look at the results for this year.
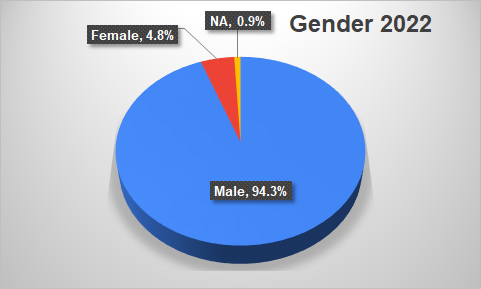
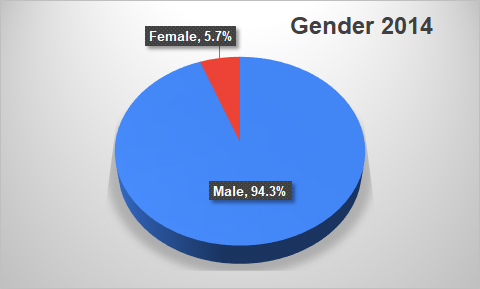
While the number of women taking the survey remains significantly lower than men, the actual percentage bounces around from year to year. When I pulled up a couple other years’ results, percentage of women who were taking the survey stayed within a fairly narrow range. The men’s numbers were in an even more narrow range. Here are some previous results:
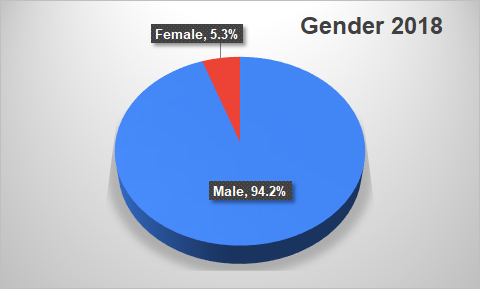
Prior to last year, we only had two options for gender: male or female. There were some who didn’t want to answer, so we added the NA option. Last year we has .05% who chose NA or didn’t answer. This year is was nearly double that.
Since open answers are difficult to process, we want to have set answers to choose from. Next year we will reevaluate the best options to be the most inclusive. And we will still give people the option to not answer
Tune in next week for more survey results.
Ted Hegemann
Ted is the Chief Writer at Infinite Discs. He is responsible for the State of Disc Golf Survey articles and most of the "best discs" posts. Ted runs all kinds of local disc golf leagues and tournaments and tournaments in Northern Utah.