Distance Driver Sales Race – Animated Graphs
Here at Infinite Discs, we love looking at statistics. The numbers always help tell a story of how the disc golf market is moving, at least when it comes to measuring how our own customers are responding to new discs or different brands. This week we thought it would be a lot of fun to make a video chart which shows actual movement of those trends through time.
Hot Distance Drivers
We know that distance drivers are considered the sports car of the disc golfer’s bag. It is one of the discs that almost every player feels defines them, their abilities, or their play style. It is one of those discs that players often swap when they feel like they need to revolutionize their game, so new distance drivers tend to get a lot of sales movement when they are first released.
That is why we thought it would be fun to track the movement of some popular, established distance drivers side-by-side with new distance drivers as they entered the market during the past 11 months. The ten distance drivers that we decided to track include some new ones that only came out in 2020, but we wanted to see how much attention they might have pulled away from the more established discs. These are the distance drivers we chose to track:
Destroyer (always a hot seller)
Wraith (another popular Innova seller)
Shryke (a somewhat newer driver by Innova)
Photon (a top-selling MVP driver)
DD3 (the new 2020 driver by Discmania)
Raider (the new 2020 driver by Dynamic Discs)
Trespass (a popular driver by Dynamic Discs before the Raider)
Pharaoh (a relatively new driver by Infinite Discs)
Force (an old driver by Discraft which became a McBeth signature disc in 2020)
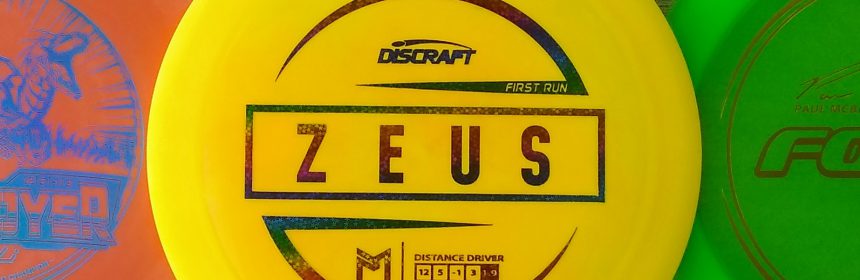
Zeus (the first distance driver in McBeth’s own disc line)
This particular selection of discs lets us measure how Paul McBeth affected the market when moving from Innova to Discraft as his brand sponsor in 2020, how new discs affected other brands, how they compared to discs of their own brand (like the Raider vs the Trespass), how market hype can play into sales, and how availability may stifle the momentum of a new release.
The Percentage Animated Graph
This first animated graph is designed to show which disc was grabbing the larger percentage of the market through the movement of time from October 2018 through August 2019. That means that we take the total sales of these 10 distance drivers, add those sales together, and compare the percentages of that total that each one grabbed.
For example, the Destroyer may have been holding 40% of the total sum of sales for those 10 discs for a couple of months, but then a new driver comes out and grabs 40% of the total sales that particular week. That would make the Destroyer percentage drop, even though it may still be selling the same quantity as the previous months, simply because there is only 100% available for those 10 discs to share. This chart helps us to see which discs were grabbing attention at any given moment. The time line will appear at the bottom of the chart.
For your viewing pleasure, here is that October 2018 – August 2019 animated chart (click the play button to activate the graph):
You’ll notice that as the new 2020 discs entered the market, they grabbed a percentage of the sales for a moment, but sometimes didn’t keep that momentum, either because of limited availability or the hype didn’t last. For example, availability of both the DD3 and the Raider was fairly limited when they were first released and it took a little time for regular stock releases to give them a boost.
The Zeus went through huge spikes depending upon availability and the releases of the prototype (originally called the Kong), the first run, and ending with the August release of the limited edition Big Z Zeus– thus the spike at the end of the video when it grabbed a huge percentage of total sales.
You’ll also noticed that the Destroyer sales moved up as Paul McBeth announced his change of sponsors, while players and collectors grabbed his old signature edition before the end of 2019. It got another boost with the new Wysocki edition.
The Force sales at Discraft started to rise based on speculation about what he would throw, and then the announcement came of the Force as a McBeth signature disc. But then the Force died down as the attention turned to the Zeus, which as a disc in Paul’s own line, was grabbing more attention than the Force.
The Race – Total Sales Animated Graph
Now for a look at a chart that takes less explanation. This is very straight-forward. We totaled the sales through time, adding to the total with new sales from October 2018 through August 2019. This allows us to watch the total sales for that period like a race where the disc that sells the most by the end is the winner.
So, rather than comparing percentage of sales, we’re just adding sales for each separate disc. Will the slow-but-steady disc end up selling most in the end? Or will the spikes on new releases help boost the newcomers to the winning position?
For your viewing pleasure, here is that October 2018 – August 2019 animated race (click the play button to activate the graph):
It’s pretty obvious that the steady sales of the Destroyer kept it far enough ahead that even the spikes on new releases, including the Zeus, could not boost those newcomers to the lead. The Zeus finished in 2nd place, getting enough large spikes to push its totals up, but not high enough to take the win. The Wraith, even with it’s slow and steady sales, gave it the 3rd place title, with the Infinite Discs Pharaoh following closely behind.
We hope that you’ve enjoyed these animated charts. Watch them over and over and see what kind of analysis you can offer in the comments below.
Todd, I love this information, but are you from the future…or am I incorrect that we’re not in 2020 yet? LOL! None of these discs came out in 2020, nor did Paul make his move to Discraft next year. At least the animation has the right years on it. Other than the confusion on what year we’re in, great read!
This is a great way to show the dominance of the Destroyer. However, I would be curious to see what the sales are like by weight class or even by altitude/zip code. Is the Destroyer as dominant in Colorado as it is in California? Are the bulk of the Destroyers sold <165g? I only bring it up because I haven't found the destroyer to be a very forgiving disc here in Colorado. Thanks for taking the time to put this graphic together!