How Many Discs do Disc Golfers Own? – State of Disc Golf Survey Results

One of my favorite survey results that I like to explore is the number of discs we own. Although most of us started with a disc or two, or maybe a starter set, over time most of us picked up a bag full that we regularly throw. Then we might have gotten a few back-up discs in case we lost our go-to’s. And we always like to try a new discs from time to time. If you play tournaments, it is common to get a disc in your player’s pack. Raffles, found discs, and gifts from friends are other ways that make our collection grow.
After playing for a while, most of us eventually end up owning scores of discs. And that is just the ones we throw. Many of us collect discs or have wall-hanger ace discs that add to our total numbers. How big are those numbers? Let’s check out the survey results and find out.
How Many Discs We Own
One of the staple questions that we’ve been asking in our annual State of Disc Golf survey is how many discs we own. It is interesting to see how many of us own the bare minimum, and how many of us have bought significant numbers of discs. Here is a graph of the results:
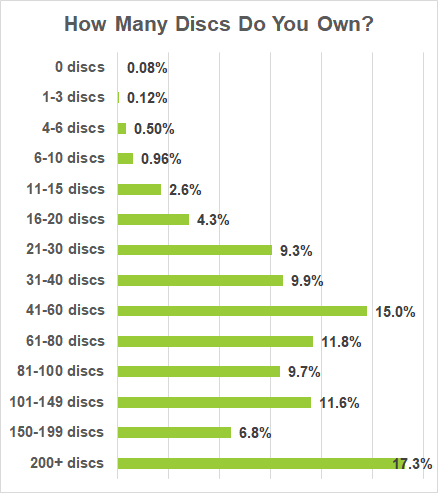
The number of discs we own slowly increases until the 41-60 range. Then the percentages bounce around a bit before finishes on the highest percentage at the 200+ category. Nearly one out of five of us has over 200 discs! One out of four of us has between 100-200 discs.
When Did We Start Playing
Those big numbers don’t surprise me. I saw how quickly I got to 200, and I know a lot of people who got there faster than me. I was curious if the people who indicated they had more than 200 discs had been playing for a while. That makes sense, since people might just be holding onto discs while buying more. Let’s look at the people in the survey who indicated that they have more than 200 discs, then see what year they started to see if my theory is correct.
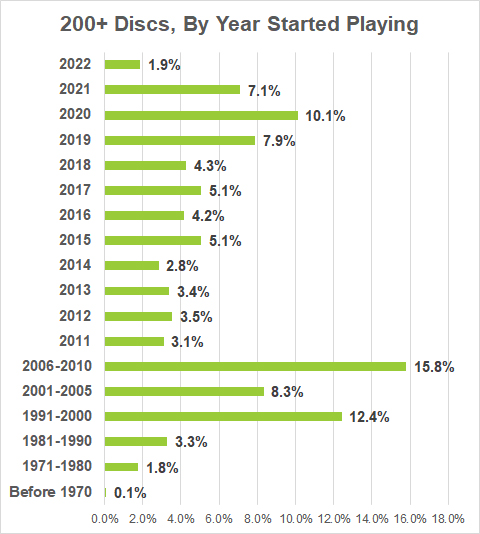
At first glance, it appears that the opposite is true. The percentages slowly decline the longer you’ve been playing. It looks like there is a spike in some of the earlier years, but that is because the graph shifts from single years to a five- year block in 2006-2010. Then it switches to a ten-year block for 1991-2000.
The people who started during the pandemic represent the largest group. They make up 10% of all people who own more than 200 discs. At the opposite end of the timeline, people who started playing decades ago make up a smaller percent of people who own 200 discs. In that case, there are fewer numbers of them. Below is a graph that shows when we started playing disc golf.
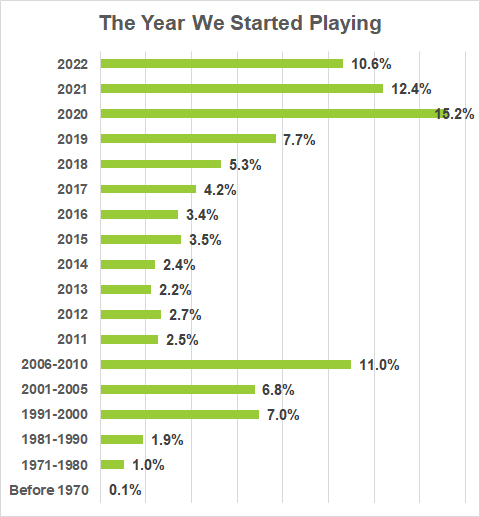
The number of people who started playing prior to 2001 represent 9% of survey respondents. But, they represent over 17% of the people who own 200+ discs. Their overall numbers are smaller than other starting years, but a high percentage of them have the big collections. If they started collecting when they started playing, they undoubtedly have some sweet discs in their collections!
We are acquiring more and more plastic!
Now let’s look at previous year’s results and see if the number of people who have 200+ discs have some kind of trend. Here is a graph of the number of people who indicated that they have 200+ discs, sorted by year:
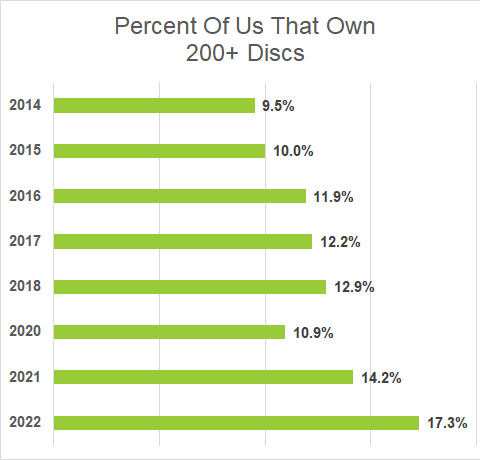
As you can see, the number of people with 200+ discs has been increasing regularly, with the exception of the Pandemic year. In fact, this year was the highest number to date, and it was a decent increase from last year. Presumably, if people keep playing, there will be more and more who hit the 200+ mark.
Collectable Discs
In addition to many of us owning a lot of discs, we also wanted to see how many people have discs that are for collecting and not throwing. I am guilty of that, and have a large collection of discs that I never intend to throw (I collect discs with bear stamps, among others). Let’s see how many collectors there are by looking at the survey results:
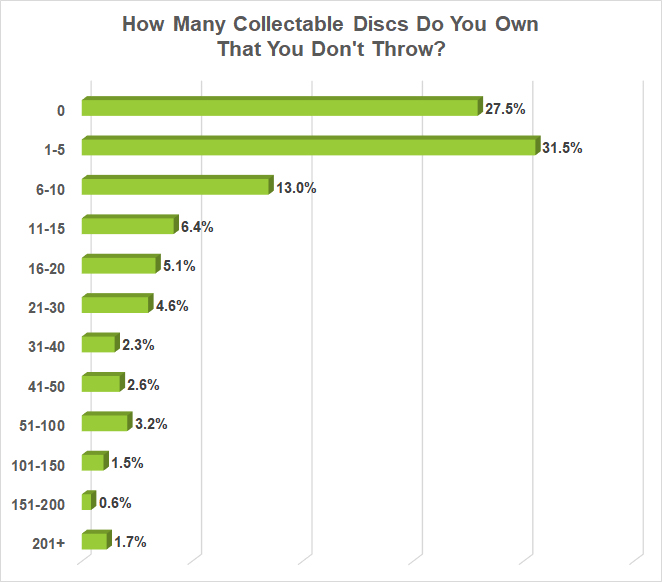
Over half of us have 5 or fewer collectable discs that we don’t throw, with nearly have of those people having zero collectable discs. That still means that most of us have at least one collectable disc. Most of us have between 1-15 discs that meet that criteria. At the extreme, 1.7% of us have 200+ discs that we will never throw. I’m one of the 1.7%.
New Collectable
For those of us who collect discs, we wanted to see how much our collections grew last year. This number might be affected by the type of discs that we collect. For example, if you collect first-run discs, the growth would depend on how many discs were released last year. If you collect all known examples of a certain mold, your growth would depend on how many became available on the collector markets.
Here is how many discs we said that we added to our collection:
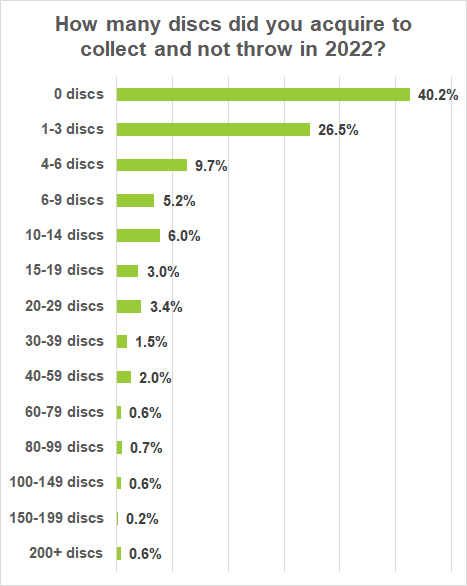
Two-thirds of us were content to add three or fewer discs to our collection. Only a tiny percentage of us added 40 or more discs. There were a few that managed to add 200+ to their collection. I want to know more about them and their collection!
Tell Us About YOUR Collection
Since the number of people who have 200+ discs is growing, I would like to add more options for survey respondents to select from, such as 201-300 discs, 301-400 discs, 401-500 discs, and 500+ discs. I would also like to know who has the most discs, or at least who the top few collection sizes. Comment below and let us know approximately how many discs that you own. If you collect discs, let us know what kind of discs you collect.
Check back next week for more State of Disc Golf survey results.
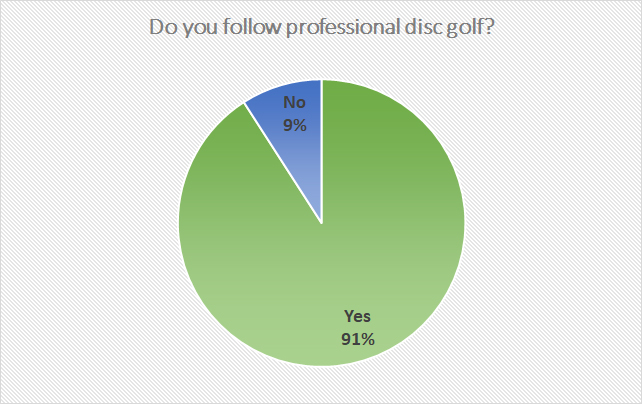
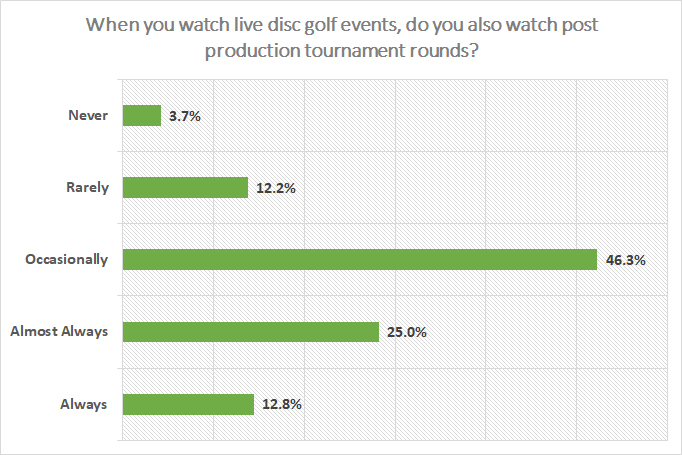
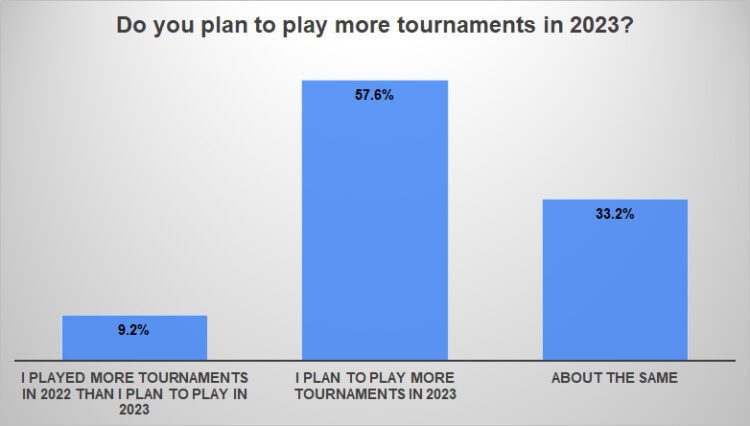
 In last week’s State of Disc Golf Survey, I talked about how we are in tournament season. I wrote about the questions in the survey that asked about tournaments and how many of us participate in them. This week, I’ll look at another aspect of tournament season: watching the pros as they play tournaments.