State of Disc Golf Results: Tournaments


Once again, tournament season is upon us. We’ve already seen the top pros battle it out on some of the first big events of the year. For those of us that love to watch the pros compete, this is a great time. We have video of the tournaments that have already taken place, and the anticipation of our favorite locations yet to come. We’ll explore the State of Disc Golf survey results revealing our interest in watching and cheering for professional disc golfers in a future blog. For this week’s blog, let’s take a look at OUR participation in tournaments.

Playing Tournaments

Along with the pros returning to the tournament scene, those of us who enjoy participating in tournaments are also getting busy checking out the local and regional competitions. Not only have I signed up for several upcoming tournaments, I’ve also scheduled dates for when registrations open, to make sure I can sign up before they fill up. (I would like to explore how many tournaments reach capacity and how fast in future surveys.)

I’m somewhat hooked on tournaments and try really hard to make sure I attend my favorites. Not everyone feels the same about competing, which is why we asked questions about tournaments in our State of Disc Golf survey. We asked WHY you attended tournaments, if you did, and which kind you attended. We also asked what keeps you from playing in tournaments, and what it would take to make you start.


There are a variety of reasons why we play disc golf, and regardless of the reason, many of us enjoy the competitive side of the sport. There is something about our nature that makes us want to compete. I’ve noticed that for many of us, participating in an event fills that need, even if we don’t think we can win. Others DO want to win and will take steps to make that happen. Still others are completely fine playing casual rounds alone, just competing to beat their own records. Let’s see what the survey reveals.


Tournaments: Yes or No


Let’s look at the first tournament-related question, “Did you play in at least one disc golf tournament or event in 2021?”


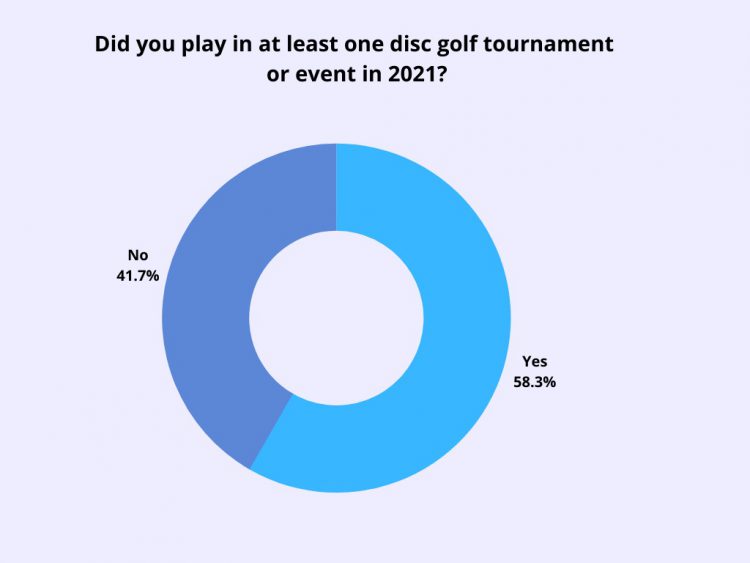
Although over half of us say we played in a tournament, I expected that number to be higher. Since there are so many casual tournaments and events, which bring out people who ordinarily wouldn’t play in more serious tournaments, it just seems like there would be more of us competing. We’ll look at why people don’t compete later, but for now let’s look at the types of tournaments we attend.

What Kinds of Tournaments?

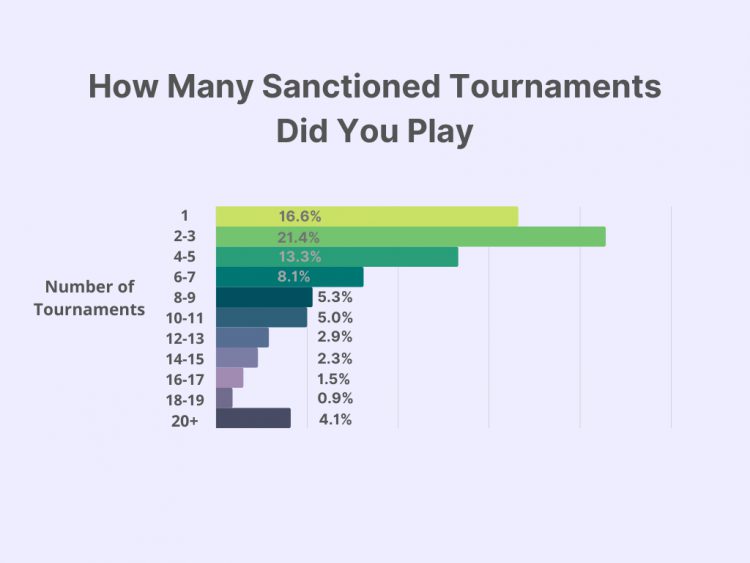
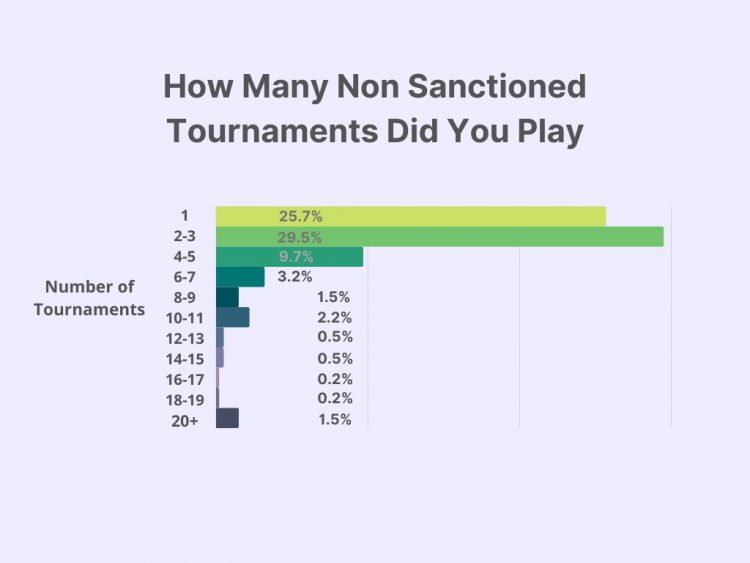
Of those who indicated that they did play in a tournament in 2021, we asked which type of tournaments they played: sanctioned or non-sanctioned. Of the 4,476 people who played a tournament last year, 75% played in a non-sanctioned tournament, and 81% played in a sanctioned tournament.  Here are some graphs showing how many of each type of tournaments we attended.


Why We Compete


Personally, I like the social aspect of competing. There are a lot of people in other areas that I only see at tournaments. It’s great to reconnect with them. And to compete against them. Most of us have a few reasons for playing tournaments. Let’s look at the survey results to see what some of those reasons are.


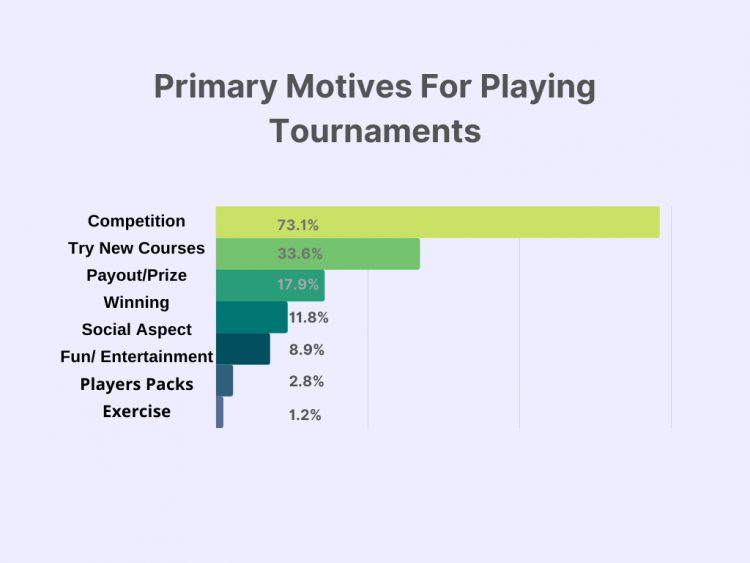
About 3/4ths of us enter a tournament for the competition. Seems kind of obvious, but that still leaves about 27% of us who don’t care about competing. The second most popular response is to try new courses. A third of use listed that as a reason for competing. Although I agree with the response, and it is definitely on my list, It surprises me that the percent is that high. Most of the tournaments that I play in are at courses I’ve already played. It’s kind of rare that I compete on a course I’ve never played before.

I like the third most popular reason people list for playing in a tournament, which is for the prizes or payout. Over 73% of us want to compete, but only a fraction of that number are doing it for the winnings. It makes me think that these same people would be competing with their buddies in a casual round if they weren’t playing at a tournament. Our species likes to compete!

No Thanks!

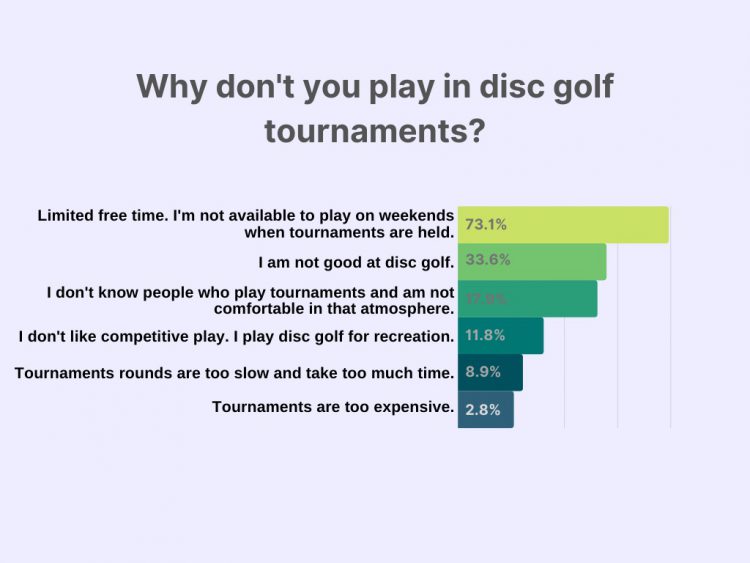
When I talk to people about tournaments, the number one reason people give for not competing is because of their skill level. They assume that everyone else at a tournament will be better and/or more experienced. I expected that to be a top reason selected in the survey. It turns out that it was the second most popular. The number one reason is because of time, or the lack of free time. Most sanctioned tournaments are at least two rounds, which is a big time commitment. We asked the people who said they don’t play tournaments what reasons they have for not playing. Here are the survey responses.


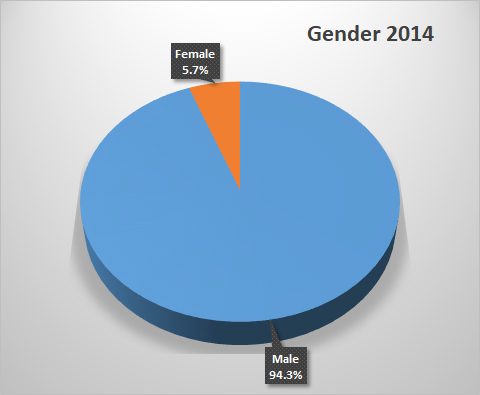
This Year VS The Past

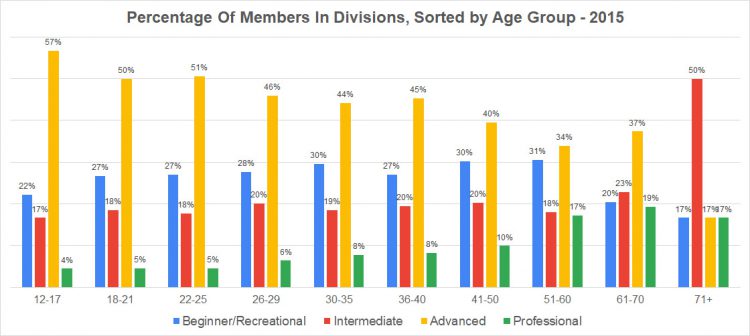
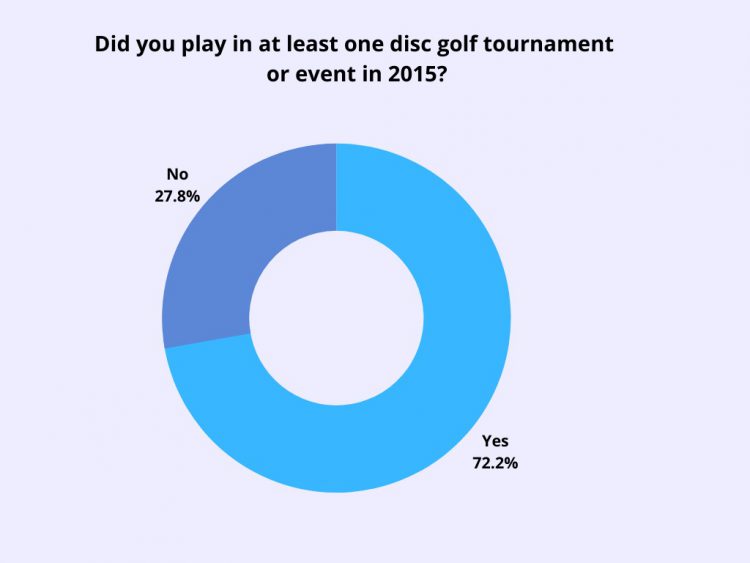
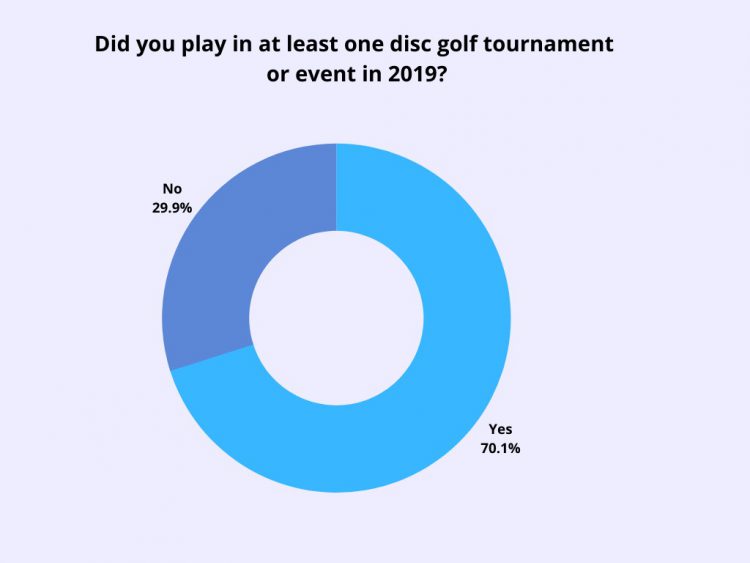
As I mentioned near the beginning of the blog, the data showing the number of people who did and didn’t play tournaments in 2021 surprised me. I see tournaments filling incredibly fast and I see newer players getting into the tournament scene, so the ratio seemed odd. To confirm my suspicion, I pulled up the results of prior surveys to see how they compare to the most recent survey. Here are the results of the question about tournament play for the years 2015 and 2019:


Clearly, we’ve seen more interest in playing tournaments in the past. The pandemic undoubtedly played a part in the lower numbers. It also contributed the larger number of newer players.  We know from the survey results that a good number of people didn’t play because they don’t feel like they are good enough. However, if you look at how fast many tournaments fill up, it is evident that there is a large number of people that want to compete, despite the percentage of people who don’t want that experience.

It is the fact that we do fill so many tournaments that I don’t worry about people who don’t want to play them. Not only are tournaments not in danger of going away, the bigger problem might be that there aren’t enough to go around. Whether or not future TDs need to consider some of the reasons people have given for not attending tournaments remains to be seen.

We would love to hear about YOUR tournament experiences and what you see tournaments looking like five years from now. Post below and let us know your thoughts.


State of Disc Golf Results: How Often We Play

As I write this blog in early March, it has been snowing recently and the temperature will approach zero tonight in northern Utah. I suspect there will still be a few local golfers that will still huck today. However, most of us will be holed up inside, waiting for a reprieve from the inclement weather. While we still play disc golf year ‘round here, there are days that the local courses remain empty, or nearly empty. Almost every time that happens, it is related to bad weather.

How often we get out to play can be heavily influenced by where we live and the weather conditions we experience. Extreme temperatures, rain, snow, and excessive winds can reduce our playing time. The level of our desire to improve also plays an important part in how much time we carve out to throw. And of course we all have life events that dictate our free time or lack thereof, such as school, family, and careers.

How Often We Play

In this blog we will explore the survey question that asked how often we get to play disc golf. We’ll breakdown those numbers based on where we live and our skill level, to see if those factors play a part in how often we play. And we’ll look at other demographics, liked age and gender, just to see if we can find any interesting numbers.

The question we asked in the survey was, “On average, how many rounds of disc golf did you play per month in 2021?” The options to choose from ranged from zero to ‘31+’ days. Here are the survey results. The first graph shows the results in raw numbers, and the second graph shows the results as a percent of the total.


Over ten percent of us are getting out to play 20 or more times per month, which is a lot of disc golf. If you are playing competitively, you are likely one of the more frequent players. Nearly a fourth of us are playing, on average, at least once every other day.

At the other end of the active spectrum, a tiny percent of us aren’t even averaging one round per month. Maybe from injury? Or an excessively busy schedule? Whatever the reason, at least they were able to fill out the survey!

The ‘one-percenters’ in this survey average more than one round per day. Whether they are going out a couple times per week and getting multiple rounds each time, or playing at least one round per day, they are the lucky ones. Or they are unemployed or retired, or professional disc golfers.

Where We Live

I started the blog discussing the weather and how it affects local disc golf. My first thought in seeing the results is that there may be a direct correlation between where we live and how much we play. Yes, we CAN play in pretty much any kind of weather. We are just more easily motivated to play when the temperatures are above a certain temperature, and when the ground isn’t covered with snow, ice, or mud.

To test my hypothesis, I took all of the southern US states and Hawaii, compared the number of rounds they played per month with the rest if the country. Not an exact science, but there is a reason why many pros gravitate to those states in the winter. Low temperatures and poor weather can still a factor, but winters in the states north of them are colder and have more snow. For the comparison, I took Florida, Georgia, Alabama, Mississippi, Louisiana, Texas, New Mexico, Arizona, California, and Hawaii. I compared those to the rest of the states. Here are the results, shown as a percentage of people in each group:

So much for that theory! There were some categories that the Southern states were slightly higher in, and others they were slightly lower. Overall, we can’t conclude that the states with warmer winters get in more rounds. Their hands may be less numb, but they aren’t playing more than the rest of us.

Skill Level

Another aspect of disc golf that I wanted to explore is to see if there is a correlation between our skill level and the number of rounds we play per month. My initial thought is that someone who plays more, gets better and considers themselves as a higher level player. Also, we could say that someone who is as better player may be more interested in playing more to maintain a competitive edge in leagues and tournaments. Below is a chart showing the percentage of each skill level, according to their monthly number of rounds.


This time the numbers are more aligned to what I would expect. Professional disc golfers represent a higher percentage of each number category above 15 per month, and is second to advanced players in the 10-14 category. In fact, the skill levels in the categories above 15 rounds per month are in order, from low to high, according to skill level. Conversely, beginners and intermediate players take the top spots in the categories below 10 rounds per month.


Conclusion


Since we are all active enough in the sport of disc golf that we took the time to fill out a survey, read the results, or both, we all enjoy the time out on a course. Sometimes the number of rounds we play in a month is dictated us and our desires, and sometimes it is dictated by our schedules and life circumstances. Hopefully, this year will see us getting in a few more rounds per month than last. We’ll conclude this blog by comparing last year’s results to a few years ago.

It is rather impressive how similar the results are from the prior survey. In every number category the results are practically the same. With all of the growth we’ve seen recently, and the life-changing pandemic, we are still throwing at about the same amount as before. Perhaps that is a good thing.

Tune in next week when we will look at more survey results.

State of Disc Golf: Skill Level

When we start out playing disc golf in a club, we are frequently confronted with the decision of which division is right for us. At a club league, it’s pretty easy to determine whether or not we are playing in the division for our skill level. If we are regularly crushing the competitors in our division, it would be time to move up to the next division. If we are the ones getting beat by significant margins, maybe a lower division would give us more competition.

When we step up to sanctioned tournaments, we have to reevaluate our skill level to determine the best division for us. A local tournament will attract a different skill level for a particular division, versus a national event. Our PDGA rating can help us find the best fit, and sometimes restrict our decisions. Having our rating and seeing how we perform at tournaments and during league can help us overcome the Dunning-Kruger effect (overestimating our skill level).

While the subject of tournaments is something that we will discuss when we analyze the results of that part of the survey, today we will cover how we view our skill level. We will look at the breakdown of skill levels based on other demographics, such as age and gender. Finally, we will look at how those numbers have changed from previous surveys.

Our Skill Level


Let’s start out by looking at how we answered the question, “How would you rate your skill level as a disc golfer?” As discussed above, how we rate ourselves can be based on a variety of things. Even those who chose, ‘Professional’ may have done so for a variety of reasons. Are they playing in the pro division for the competition, despite having a PDGA rating that would qualify them to play in an Amateur division? Here is the breakdown of how we self-identify our skill level.


With half of us identifying as having intermediate skills and more than ¾ of us identifying as a beginner or intermediate player, my first thought explaining those numbers is the rapid growth we’ve seen in disc golf the past couple of years. We could conclude that since there were a lot of people who just started playing, they wouldn’t have progressed past the Intermediate level by now. We can look at other data in the survey to see if that hypothesis is correct. First, let’s see how those numbers have changed since earlier surveys.

Checking out the survey results from 2015, we see a higher percentage of players identifying as being in the Advanced or Professional divisions than this year’s survey.


Skill vs Time Playing


Let’s compare the skill levels when they are sorted by the year the player started playing disc golf. That should show us how the pandemic affected our skill levels as a group. Here is the chart:


We can see that around 30% of all survey respondents started playing in 2020 or sooner, and identify as a beginner or intermediate player. That certainly accounts for the larger number of total players in those divisions, as compared with the survey results from seven years ago. It will be interesting to see how fast people move up skill levels in future surveys.

Now let’s take another look at our skill levels and organize them by gender and age. We’ll start by looking at data from last week, our numbers when sorted by gender. Although the number of women taking the survey was up over 2015, the percent of women dropped a bit this year compared to the earlier data. Here is the chart showing the numbers for 2015 and 2022:


Here is how the number of each skill level look, when sorted by gender:


As we can see, the skill level representing the largest number of men is intermediate. It represents 48% of all respondents, and over half of all the men who responded. For the women, the beginner/recreational division is the largest. Nearly half of all women who took the survey are in this skill level.

Sorting By Age


If we were to look at our skill level according to our age group, what would we expect to find? More pros in the prime ages? More beginners in the younger groups? We can find out by sorting age groups into skill levels. We’ll start by looking at the raw numbers, then we’ll sort them by skill level and the percentage in that age group. Here is the raw data:


I think it is more interesting to see how each age group is divided according to skill level. In other words, it is more interesting to look at the age group that you play in, for example, and compare it to the same age group in 2015. First, let’s take a look at the results for the most recent survey.


That tells us that the group with the highest number of pros is the 51-60 age group, which has about 5% of its members that are pros. The group with the highest percentage of beginners is the 71+ age group (not counting the under 12 age group). Interestingly, the 12-17 age group has the highest percentage of intermediates AND advanced players.

We can now compare those numbers to the ones in 2015.


The 2015 graph shows that the 61-79 age group had the highest percentage of pros, with nearly one in five members of the age group identifying as a professional. The 51-60 group took the top honors for the percentage of the most beginners, although the group barely beat the 30-35 and 41-50 age groups. The 71+ age group was the intermediate leader and the 12-17 was the advanced leader, both groups holding on to the titles for 2015 and 2022.

It’s interesting to see the change in how many people consider themselves ‘advanced’ players. There were more advanced players than any other skill level in all but one age group in 2015. But in 2022, the advanced division wasn’t the largest in any group. Instead, the intermediate division was the most popular in every division.

Check back next week when we will continue to look at more survey results.

State of Disc Golf: Demographics

2022 State Of Disc Golf


We’re back for another look at the State of Disc Golf as we start the tournament season for 2022. Just like last year, our world and our sport is being affected by the global pandemic. While it appears society is looking more ‘pre-pandemic’ than last year, we are still dealing with its effects on the supply chain. Many molds and products are still not available. But, while we can’t control what is available to sell, we can still look at the world of disc golf and analyze the data to see how disc golf looks this year, and how it has changed over the years that Infinite has been running the survey.


Age, State, and Gender


This year we had over 7650 people take the survey. We’ll take a look at a variety of answers every week for the next couple of months to learn more about our sport and the people who play it. We’ll start with some basic demographics, looking at our age, where we live, and our gender. Let’s start with our ages.


Aging Divisions


One thing that I’m always curious to see when looking at the results of the survey is how the numbers compare to what I see in the disc golfers in our region. Our local club is small and it seems like the demographics are pretty close to how it looked when I started playing regularly about 10 years ago. But, we see other clubs at tournaments so it is still possible to get a large sample size.

What I see happening in the tournament scene is that the 40-plus divisions are getting bigger. That is encouraging to see because it means more people are continuing to play as they age. We are still getting young players take up the sport, which is great for the future of disc golf. But, the older divisions are growing. Let’s see how that compares to the survey results.

Below is a graph of the results of the question, ‘How old are you?’


We’ve seen the basic shape of the graph in previous surveys. The 30-35-year-old group is the largest, then a drop in the 36-40 group, followed by a spike in the 41-50 group. The 41-50 group is the first group that includes 10 years. In looking at previous years’ results, however, we see a sharper drop after the 30-35 group. We’ll look at a couple different years, and to compare them equally we will look at the percentage of respondents in each group, rather than the total number. Here are the graphs from previous surveys.


It’s good to see the growing size of the older groups. We’ll look at other survey questions to find out more about them and their disc golf world.


Where We Are From


The sport of disc golf is played in countries all around the world. We have seen non-US players battle it out with the top US pros on top-tier tournaments, and pick up wins. Recently, Estonian FPO player Kristin Tattar make headlines with her lucrative contract with Latitude 64. There is no doubt that disc golf is a global sport. There is also no doubt that the United States still has the largest number of disc golfers, and the survey showed that. Not surprisingly, the largest number of disc golfers are in the states with the biggest population. The states in the top ten will exchange positions from year to year. But it’s tough to find more disc golfers if your home state doesn’t boast the sheer number of people in other states. Here is the leader board for this year.


I was curious to see the ratio of disc golfers were in every state, so I got the population numbers from World Population Review website to find out. I divided the number of survey participants for each state into the population of that state. Here are the results:

State # Survey Participants 2022 population DG Density 1:x
Vermont 43 622,882 14,486
Utah 230 3,363,182 14,623
Oregon 209 4,325,290 20,695
Maine 62 1,359,677 21,930
Kansas 127 2,919,179 22,986
Colorado 256 5,961,083 23,285
Minnesota 228 5,739,781 25,174
Delaware 38 998,619 26,279
Idaho 71 1,896,652 26,713
Michigan 348 9,995,212 28,722
Missouri 206 6,184,843 30,024
Wisconsin 188 5,867,518 31,210
Indiana 204 6,842,385 33,541
Iowa 93 3,174,426 34,134
Washington 225 7,887,965 35,058
Ohio 331 11,727,377 35,430
North Carolina 291 10,807,491 37,139
Tennessee 182 7,001,803 38,471
Pennsylvania 331 12,805,190 38,686
South Dakota 23 902,542 39,241
Kentucky 113 4,487,233 39,710
Nebraska 48 1,960,790 40,850
Illinois 304 12,518,071 41,178
Alabama 117 4,949,697 42,305
New Hampshire 32 1,378,449 43,077
South Carolina 124 5,342,388 43,084
Montana 25 1,093,117 43,725
Connecticut 81 3,546,588 43,785
Virginia 194 8,638,218 44,527
North Dakota 17 774,008 45,530
Alaska 15 720,763 48,051
Oklahoma 83 4,007,179 48,279
Arkansas 63 3,042,017 48,286
West Virginia 35 1,755,715 50,163
Georgia 201 10,936,299 54,409
Texas 552 30,097,526 54,525
Maryland 107 6,075,314 56,779
Arizona 132 7,640,796 57,885
Massachusetts 118 6,922,107 58,662
Mississippi 49 2,961,536 60,440
New Mexico 31 2,109,093 68,035
California 529 39,664,128 74,979
Rhode Island 14 1,062,583 75,899
Hawaii 18 1,401,709 77,873
Florida 269 22,177,997 82,446
New York 214 19,223,191 89,828
Nevada 36 3,238,601 89,961
Louisiana 48 4,616,106 96,169
Wyoming 6 582,233 97,039
District of Columbia 6 718,355 119,726
New Jersey 68 8,870,685 130,451


The state of Vermont has one disc golfer who took the survey for every 14.4k people. Utah is in second place, but that likely has a lot to do with Infinite’s headquarters being in Utah. California, which routinely has among the highest number of people who take the survey, is near the bottom of this list.

Infinite has customers around the world and many of them participate in the survey every year. For Canada, we broke the numbers down by province. For the rest of the world, we had participants select the region of the world they live in. Here are the results:


Gender


When it comes to the part of the survey that asks about gender, there is never really a question of which gender will have the highest number. But I am always interested to see if there is growth in the number of women taking the survey. Presumably that would mean a growth in the number of women in our sport. With so many of the top women disc golfers signing contracts that they are excited about, and with so much exposure in terms of tournament coverage, we certainly seems poised to grow the women’s side of disc golf. Things like last year’s FPO World Championship, which was every bit as exciting as the MPO Championship, should add a little more fuel to the fire of growth.

We’ll look at the results from past surveys and compare those to the most recent survey.


Although the data shows a slight drop in the percentage of women vs men taking the survey, the raw numbers are slightly up. In 2014, 286 women took the survey. In 2020, there were 330 women who took the survey. I would hope that the percentages would at lease stay the same as the number of disc golfers rises.

The PDGA shows fairly steady ratios between men and women between 2014 and 2020. Considering the explosion of growth in disc golf, that means that at least the number of women disc golfers who take the sport seriously enough to join the PDGA is rising. As we explore the rest of the SoDG survey, we might find data that will shed more light on the subject of women in disc golf.

In the previous two surveys mentioned in the charts above, we only had two choices for gender. That is why in this year’s survey there is the third option. We wanted to have an option for those who don’t identify with the binary choices.

State of Disc Golf Survey 2022

It is time for our annual State of Disc Golf Survey where we ask for all disc golfers everywhere to share their thoughts and experiences with the sport through some simple survey questions. This survey has become a great way to see how the sport is growing and evolving. We have really appreciated everybody’s input in the past.

Where to Take This Year’s Survey

You can take the 2022 State of Disc Golf Survey by going to THIS LINK

https://docs.google.com/forms/d/e/1FAIpQLSd64quY1SNFa0rAPZawSnrTYRWJgelTN6UU4u898n2wHMXAxw/viewform?usp=sf_linkhttps://forms.gle/3wgCzP2uKWkbERfeA

Feel free to share that link on social media and with your disc golfing friends. The more opinions that are shared, the better!

Where to See Previous Survey Results

We always share the data from these surveys through the Infinite Discs blog. You can click easy links to see those different articles presenting the results. Here are links for the previous three years:

State of Disc Golf 2021 Blog Posts

State of Disc Golf 2020 Blog Posts

State of Disc Golf 2019 Blog Posts

It’s worth taking a look at those blog posts for all of the fun charts and analysis. Here’s an example from the 2019 survey showing how many discs did survey participants collect without any intention of throwing in 2018?

Random Prize Winners Will Be Selected

As usual, we will be giving away a few prizes to randomly selected participants. We’ll be giving away some slinger bags, discs from boutique brands, and other prizes and you have a chance to win if you take the survey this year. Winners will be contacted after the survey is complete.

THANKS FOR YOUR PARTICIPATION!

1 2