State of Disc Golf Survey: Practice and Play

2023 State of Disc Golf Survey

The greater disc golf community has a large variation in the level of participation in our sport. There are those among who currently are (or are working toward) making disc golf a career, and who play or practice daily.  At the other end of the spectrum, there are people who may only play once or twice per year. They may not even own their own discs. This week’s State of Disc Golf blog will discuss a few survey results that will help us see where we lie on that participation scale.

One of the ways we might express our participation level in disc golf is how many tournaments we play. Typically, if you like to play tournaments, you probably play more disc golf than the average person. And you might spend a bit of time practicing for tournaments. In the survey, we wanted to find out how often people practice putting and doing field work. We’ll look at those responses and get a snapshot of the current level of participation in disc golf.

Putting Practice in Winter

To dissect the data a little more, we asked about how our practice habits change from summer to winter. We’ll start with putting practice in the winter. Here are the survey results

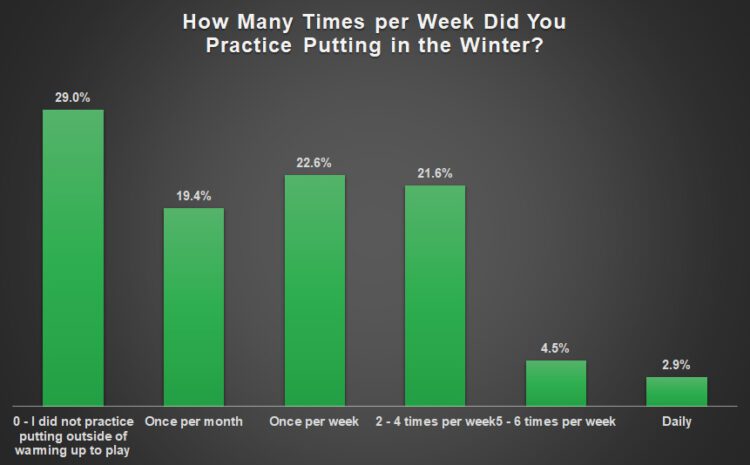
An impressive number of us, 29%, practice at least twice per week in the winter. If you live in a climate that allows for comfortable outside play, or if you can putt indoors, you are more likely to keep putting when the temperatures drop and the snow flies. Putting leagues are another way to be competitive and keep practicing in the winter. Now let’s see how warmer weather affects putting practice.

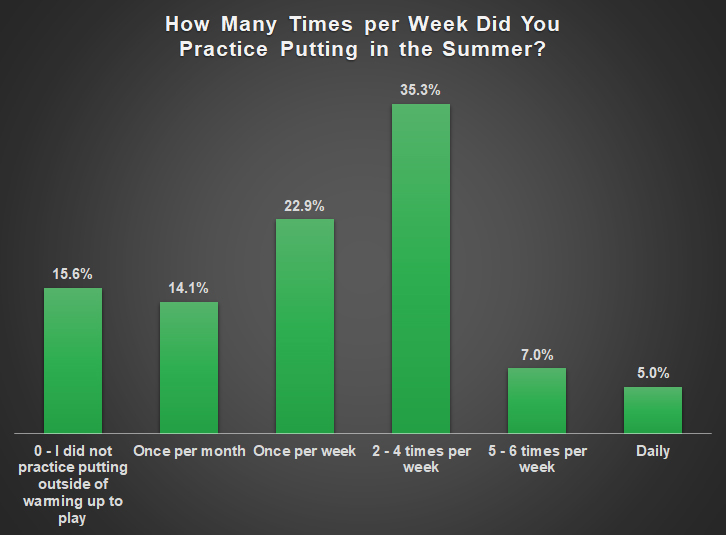
Putting Practice in Summer

Almost half of us are committed to practicing putting in the summer at least two times per week. Nearly 16% don’t do any extra putting practice, but the rest of us will break out the putters at least once per month.

Since missed putts can add so many strokes to our scores, we would all benefit from practicing. Unfortunately, putting practice isn’t the most fun activity in disc golf.  We can improve our chances of putting regularly by playing putting games. There are solo games that you can play, where you keep track of either points or consecutive makes. And there are games you can play with others. Playing putting games makes the time and the reps fly by.

Fieldwork in Winter

A cousin to putting practice is field work. Throwing discs in a field is a great way to work on our form and our distance. Regular practice will improve our consistency and conditioning. Field work is a little more fun than putting, to me, because you get to watch the flight of the disc and feel the satisfaction when you get a great rip. It is tougher to do in the winter in much of the country, because of snow. Let’s see what the numbers say about field work

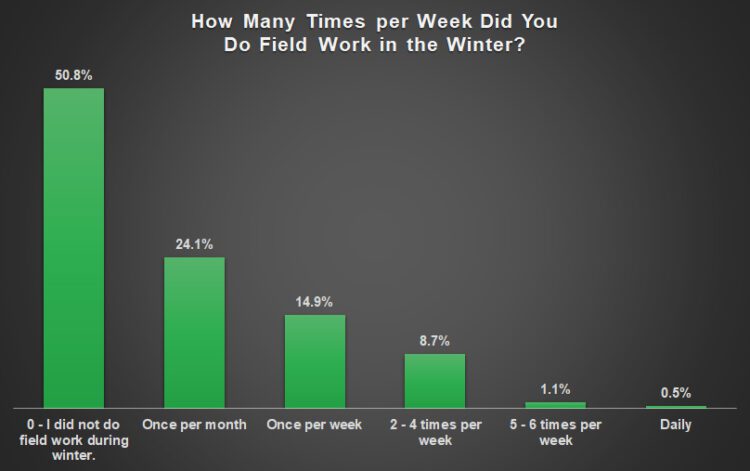
Just over half of us don’t do any field work in the winter. Cold and snowy conditions are probable responsible for keeping most of us indoors instead of out practicing in the winter. Another reason could be that the days are shorter and we might not get off work in time to practice.  About 10% of us still manage to get out at least twice a week in the ‘off-season’.
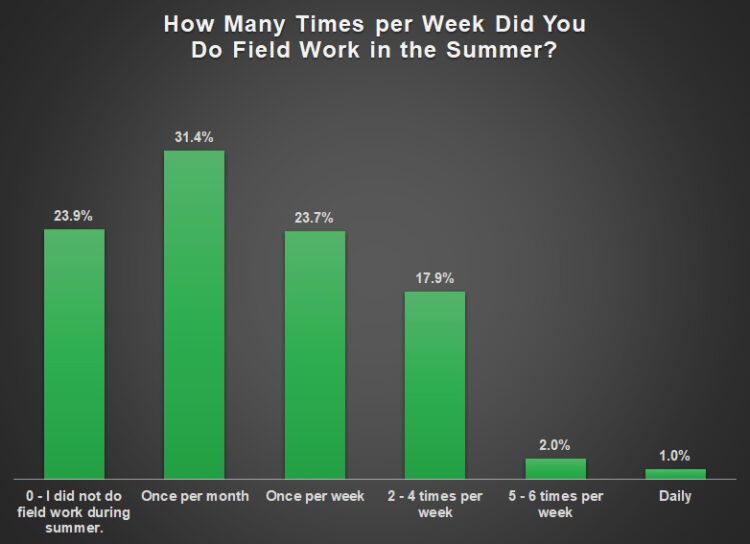
Fieldwork in Summer

Now we’ll take a look at how much change there is from winter to summer. Below is the chart for summer field work and we can see that over 75% of us do field work at least once per month. One in five of us practice two or more times per week. Those numbers are a little higher than what I see locally, but maybe people are practicing at non-disc golf fields.


Data From 2017

We’ve asked similar questions in the past, so let’s look at the numbers from 2017.

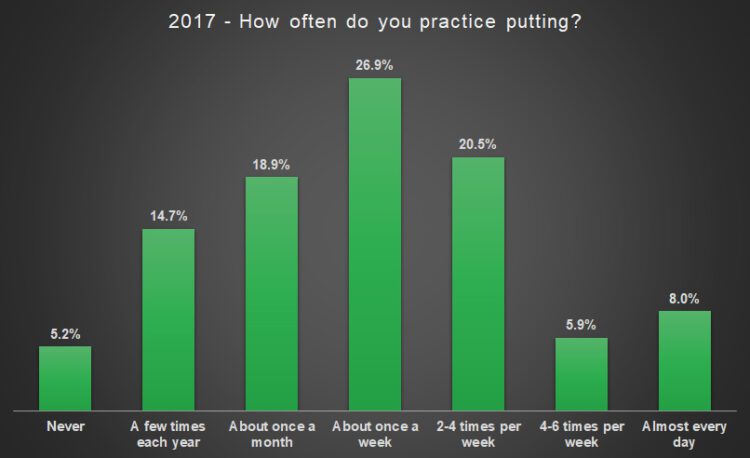
The data from 2017 shows that a lot more people indicated that they practice putting regularly. A third of us practiced at least twice per week. And a lot fewer people indicated that they either never practice putting, or only practice a few times each year. Let’s see how the fieldwork numbers compare to the recent survey.  Here are the results from 2017:

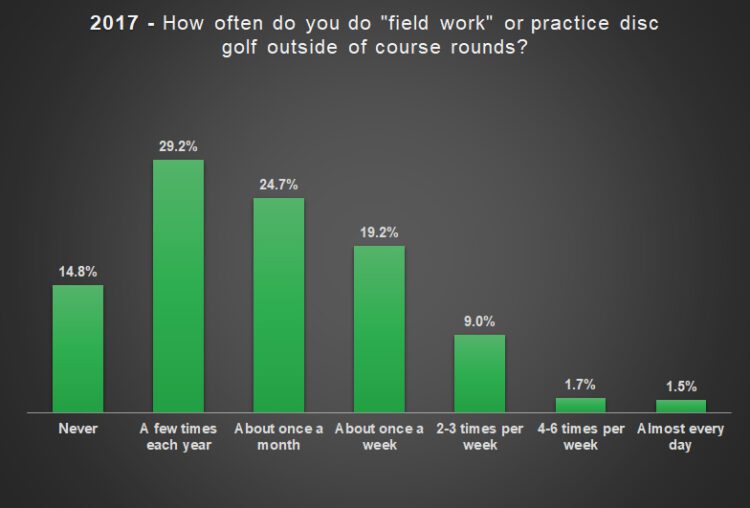
The number for the 2017 fieldwork results is similar to the results for this year’s results about fieldwork in the summer. There are slightly more people today who never do fieldwork, but most of the numbers from 2017 are similar to this year’s numbers.

Rounds Per Month

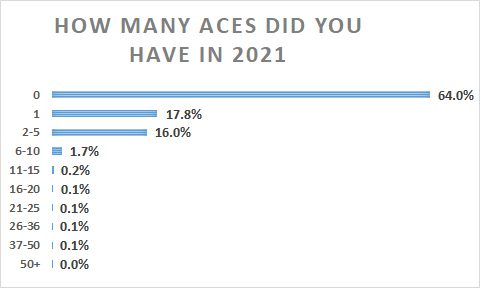
Another survey question that shows how active we are in disc golf is how many rounds per month we played last year. That question was only for those who started playing in 2021 or before. The results are pretty close to what I would guess. Let’s take a look at the chart.

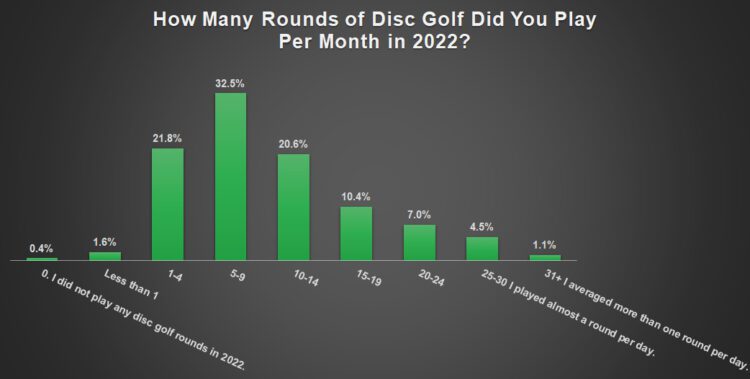
A small percentage of us only averaged less than a round per month. However, at the other end of the scale, over 5% of us got to play nearly a round per day! Playing in leagues and tournaments regularly will bump your average up a bit. Add a few casual rounds with your buddies and it’s not too hard to get up to double-digits per month. However, over half of us stayed in single-digits.

More or Less Golf Last Year

In addition to seeing how many rounds we averaged last year, we also wanted to see if the number of rounds we played were more or less than in 2021, or if it stayed the same. Here is the data:
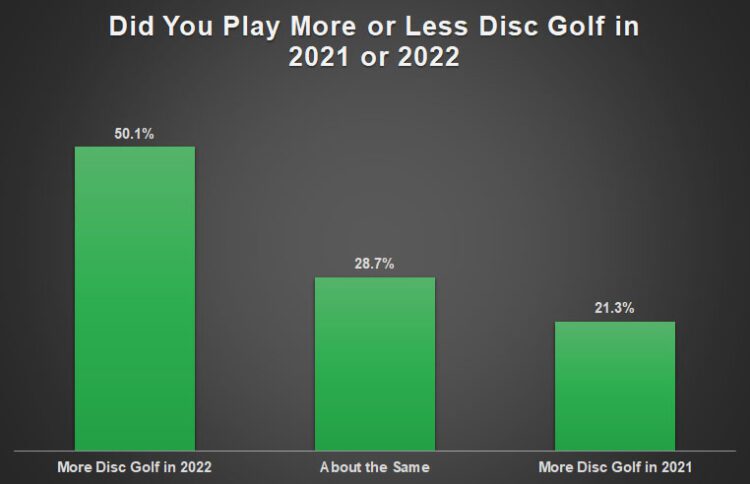
Prediction For 2023

It’s good to see that a significant majority of us played either the same or more disc golf in 2022. Regionally here in northern Utah there is a tournament or league happening every week, so it isn’t difficult to get your golf fix, if you have the time. Although we can predict how much free time we’ll have in the future, we did ask how much golf that people thought they would play this year compared to last. Here are the results:

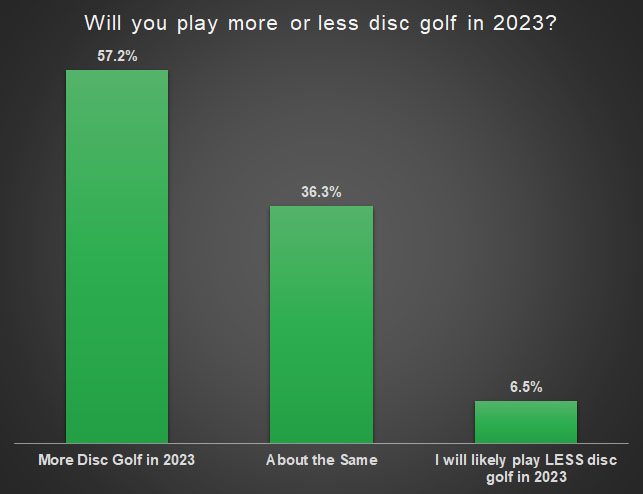
I like people’s optimism about this year. Most of us will be playing as much or more disc golf this year. Let’s hope that works out for all of us!


Tune in next week for more State of Disc Golf survey results.

State of Disc Golf Survey: Demographics

Once again it is time to check out the results of the Infinite Discs State of Disc Golf survey. We had fewer surveys taken this year versus last year, but we still had 6536 people take the survey. I always look forward to seeing some of the results, which are a snapshot of the current state of disc golf. It’s also fun and interesting to compare this year’s results with prior years. Let’s check out the results.

Demographics

Every year we ask people about their basic demographics. We asked where people live, their age, and their gender. We’ll start with where we live. In the survey we gave people the option to select any of the 50 US states plus the District of Columbia, Canadian Providences, Australia, New Zealand, many countries in Europe, and several regions around the world. Hopefully, through the work of the McBeth foundation, in the future we will need to include all countries in Africa, Central and South America.

Where We Live

You probably won’t be surprised to learn that the states with the most survey participants are also the most populated. However, after the top two, the survey doesn’t match the list of the most populated states. Here is a chart of survey respondents according to where you indicated that you live:


Historically, the states with the highest number of respondents will vary slightly from year to year. As mentioned above, the most populated states are typically in the top of the results. But, that doesn’t tell us the per capita results. So, I took the survey results and compared them to the state population to see which state had the highest participation rate. Again, the state in the number one spot won’t be much of a surprise. In the chart the number by the state indicates how many people are in the state for every person who took the survey. Here is the chart:


The home state for Infinite Discs is Utah, so it’s easy to see why we had the most participation per capita. Third place Idaho is right next door to Utah, and even has an Infinite store. Sandwiched between those two states is Vermont. With its sparse population, it doesn’t take a lot of people who took the survey to make them move up the chart. Oregon and Kansas have much bigger populations, and also good survey participation.

At the other end of the spectrum, Rhode Island and Washington, DC had the least participation per capita. Out of curiosity, I looked up both of those states’ PDGA membership. DC has 128 members (current and expired), while Rhode Island has 300. Utah, at the top of the per capita chart, has 2210 PDGA members.

Our Age

We did something with this survey that we should have done a long time ago: we cleaned up the age ranges that you could select. For example, instead of indicating whether you are 18-21, 22-25, 26-29, etc., we asked in 5-year increments. So, 20-24, 25-29, 30-34, Etc. While I like the 5-year blocks, it makes it tougher to compare this year’s results to previous years. But, we’ll do what we can. Here are the results of this year’s survey:


The resulting graph looks generally similar to results we’ve seen in the past. The numbers slowly climb as we approach 30, then slowly decline as we age past 35. Nearly a fifth of us fall in that 30-34 group that is the largest. That is close to the same number of all players 50+.

Let’s look at a couple of previous years’ results so we can see where the numbers might have changed.

It looks like the age group that is consistently the highest is the 30-35 ish range. This year, however, that age group gave up some numbers to those of us who are younger and older. Let’s look at the under-30 group, the 30-39 group, and the 40+ group.


The survey results for the 40+ age group reflect what I see in tournaments in the area. The age-protected divisions are growing rapidly. As someone who plays in that group, that news is very encouraging. Hopefully that trend doesn’t stop, which will allow current young players to have a lengthy disc golf career.

It’s also encouraging to see younger players in the area, and see their numbers continue to grow. Despite the stats in the survey, we are doing pretty well as a sport. The future looks great and disc golf should continue to grow and expand. It really helps to have some of the young pros that the youth in disc golf can look up to and aspire to be.

Gender


When it comes to gender in the sport of disc golf, the numbers are probably always going to lean massively toward the guys. That’s what we see with the pros, and at most tournaments. Even so, FPO players are seeing the same relative increase in the number of competitors who are considered top tier. That is exciting for those of us who are fans of the pros and watching competitions. And beneficial to disc golf. We’ve already seen some great FPO tournament finishes this year, and with the number of top players increasing, we’re sure to see more. Let’s look at the results for this year.


While the number of women taking the survey remains significantly lower than men, the actual percentage bounces around from year to year. When I pulled up a couple other years’ results, percentage of women who were taking the survey stayed within a fairly narrow range. The men’s numbers were in an even more narrow range. Here are some previous results:


Prior to last year, we only had two options for gender: male or female. There were some who didn’t want to answer, so we added the NA option. Last year we has .05% who chose NA or didn’t answer. This year is was nearly double that.

Since open answers are difficult to process, we want to have set answers to choose from. Next year we will reevaluate the best options to be the most inclusive. And we will still give people the option to not answer

Tune in next week for more survey results.


2023 State of Disc Golf Survey

2023 State of Disc Golf Survey

The President of the United States issued the State of the Union address last night. Now it’s time to find out the State of Disc Golf.

The State of Disc golf survey is conducted annually by Infinite Discs to help us find out trends and opinions among the disc golf community. After survey results are gathered, analysis of the results are published here weekly on our blog.

Past years surveys have discussed topics such as who we are as disc golfers, disc golfer demographics, brand popularity, how we play, practice, tournaments, disc golf clubs, favorite pros, disc golf media, discs we own, bag/cart preferences, and some controversial topics.

Take the State of Disc Golf Survey Here

Use this link to take the 2023 Survey

https://forms.gle/JrM6U7BeobbuxXZF6

Why Take The State of Disc Golf Survey?

By taking this survey you are gathering fun information and helping out stakeholders within the disc golf industry. Results are valuable to disc golf companies, sponsors, tournament directors, course designers and local communities.

Win Awesome Disc Golf Prizes!

By taking the survey you’re also available for a variety of different disc golf prizes. In the past we’ve given away disc golf bags baskets carts, gift cards and lots of discs.

Prize winners are randomly selected and all you need to do to be eligible is to take the survey!

Read Previous State of Disc Golf Results

According to the 2022 survey results, Paige Pierce was overwhelmingly the most popular FPO player. We have a feeling this years results will be much different. With disc golf trends and popularity changing so quickly it’s fun to compare the different year by year trends.

Check out previous years state of disc golf articles state of disc golf articles here:

The State of Disc Golf: Disc Golf Con

Throughout the course of the State of Disc Golf survey results bogs, I’ve mentioned the effects of the pandemic on our sport. Everything from supply issues affecting our purchases to our attendance at tournaments were affected to some degree by Covid-19. Infinite Discs was no different.

If you’ve been shopping with Infinite, or have been following our social media, you’ll know that the past two years have been challenging and at time frustrating as we grappled with supply chain issues. Just as the number of people who were playing disc golf skyrocketed, many of our suppliers were having trouble making the products that we, and other retailers, desperately wanted to have to sell to our customers.

While all retailers were in the same boat when it came to keeping stocked with the discs we wanted, there was one aspect of the pandemic that cut a little deeper for us. That would be the forced postponement of what was to be the inaugural Disc Golf Con.


Disc Golf Con


In case you aren’t familiar with Disc Golf Con, it was going to be a convention dedicated to the fans of disc golf. There were going to be flymarts with vendors selling disc golf goodies, professional disc golfers running a variety of clinics, limited edition discs for attendees, the option to caddy for pros, the option to play with the pros, and it would have opportunities to attend panels and a swap meet. Attendees would also have the opportunity to watch the top pros in our sport play for $84,000 cash!

The Disc Golf Con (DGC) was going to be held in Las Vegas in conjunction with the Las Vegas Challenge. We worked hard to prepare for the DGC.  We worked with pros, a hotel/convention center, and Wild Horse Golf Course to plan for a successful convention. Then, in January came a spike in the number Covid-19 cases and the decision was made to postpone DGC until 2023.

While it was very disappointing to put in the work preparing for the DGC, only to have it postponed, we also feel like we learned a lot and the inaugural event next year will be better because of our experiences. Which brings us to the topic of this week’s survey results: your thoughts about Disc Golf Con.

Were You Going?


In our survey we asked several questions about the Disc Golf Con. We asked if you had been planning on attending, and if not, what might make you change your mind. We also asked about your opinions on several aspects of the convention that we had planned. Below are the results.

The first question we asked was simply, “Were you planning on attending the Inaugural Disc Golf Con?”

Here are the results:

While only a small percentage of us indicated that we were planning on attending for sure, we were confident that those numbers would rise as the convention got closer. Between those who had already purchased tickets, those on the fence, and those who were just learning about DGC, we felt like there would be enough people attend to make the convention a success.


Not Going to Attend


The next thing we wanted to find out in the survey was why people weren’t going to attend. We had a list of responses, and allowed people to add their reasons if they weren’t on our list. The overwhelming majority of the ‘other’ responses were because of scheduling or responsibilities that prevented people from getting time off to attend. Many people chose more than one answer. Here are the results of the options offered:


The most popular answer is location. We’ll explore that a little more in the next section. The next highest answer is time. You would definitely have to use some vacation days to attend a multi-day event. Ten percent of us are still concerned about the pandemic, and nearly 20% of us wouldn’t attend because of the costs.


Motivation


The next question was for people who indicated that they definitely were not attending DGC. We asked what it would take for them to attend. Since it took a while to get through all of the answers!

After dismissing all of the responses that wouldn’t ever happen, such as covering for people at their job while they were in Vegas or babysitting for them, we were left with a good idea of what would get the most people to attend. Below is a list of the top 5 answers.


Hands down, the top response was location. Not that everyone disliked Vegas in general, although many specifically mentioned that they didn’t want to go there. It was mainly just too inconvenient to travel that far to attend a convention. Many in the survey indicated that they would attend a regional disc golf convention. Others said it would have to be in their home town for them to attend. While having a DGC in every major city would be impossible, having one more centrally located is something to consider.

The second most popular response was concerns about Covid. Some people were concerned about being around that many people at an indoor event. Others were mainly concerned about traveling in a plane during a pandemic. We sincerely hope that Covid will be much less of a factor next year.

The next three responses on the list are things could be considered and/or implemented. They are: Virtual options, all-inclusive packages (flight, hotel, tickets to the convention, etc.), and more unique swag.


Ticket Pricing


The next DGC-related question concerned the cost for tickets to the convention. We put a lot of thought into the ticket pricing, given everything you would get for your ticket. We felt it was a fair price, and certainly in the range of other large conventions. Here are how those who were not attending thought about the ticket prices.


Over half of the respondents either thought that the price was what we could expect for a convention of this size, or that the price wasn’t preventing them from attending. Over 46% indicated that they would pay less than $100 for tickets, with about 20% saying they would buy tickets if they were under $50, and nearly 27% saying they would spend between $50-100 for tickets.


Excited/Don’t Care


The final question about DGC we wanted to cover in the survey was to see which aspects of the convention appealed to you. We asked you to rank those events on a scale from ‘Don’t Care’ to ‘Very Excited’

Let’s start with the list of events that respondents are very excited about. Below is the list. I was surprised to see the high-stakes rounds rank so low. That was one of the things I was most looking forward to! Topping the list is people’s desire to get something unique from the event.


Conversely, below is the list of things that are the least appealing:


DGC Next Year


We are looking forward to next year and the inaugural Disc Golf Con. We are already planning and preparing so we can make sure it is a memorable event, and one that will grow and become better in the future. We’ll start making announcements as soon as we can. We sure hope to see you there!


The State of Disc Golf: Clubs and Leagues


Our local club, Cache Valley Disc Golf, began about 10 years ago. Currently, to ‘join’ the club, all you really need to do is just come out to play at league. We do offer a bag tag for $15, which is completely optional, and that tag allows you to compete for various CTP prizes that are reserved for tag holders. Don’t want to buy a tag? No problem, you can still compete at league.

The cost to play in league is $5, if you want to play competitively. You pay and choose division you want to compete in. Don’t want to play competitively? No problem, we offer a free Recreational division. In other words, if you either can’t or don’t want to pay to play, you can still join us for some disc golf.

We also offer two ace pots: a $1 ace pot and a $5 ace pot. The $5 one obviously grows much faster, often times making for a sweet payout for an ace. There are two optional CTP’s that cost $1 each, one for the cash in the ace pot, and one for a gift card. The total cost for the weekly single league if you pay for every option is $13.

In addition to our weekly singles league, we have a weekly doubles league. The total cost for everything is in doubles is $10. Recently, one of our club members started a flex league. That costs $6 to play if you want to compete for cash and buy in to the ace pot.

Total weekly cost if you want to play in all of our leagues and choose all of the optional buy-ins: $29.


Clubs


Which brings us to this week’s State of Disc Golf Survey subject: Clubs and leagues. In the survey, we asked how many of you belong to a Club, and all of the costs associated with joining and playing in your club events. Let’s check out the data.

The first thing we’ll look at is how many of us belong to a club. Many of us have played in clubs for years and can’t imagine not having that camaraderie and competition in our sport. Others of us are fine playing with the friends and family that we always play with. Many of us play alone, competing against ourselves, or just playing for fun.

The question we asked was, “Did you belong to a local disc golf club in 2021?” Here are your responses:


Since nearly two-thirds of us indicated that we belonged to a club last year, the next thing we wanted to look at was the cost to join the club. Many people gave a range, so we took the highest amount in the range for comparison. For those respondents outside the U.S., I did my best so convert the cost to USD.  Here are the costs to join for those who indicated that they belonged to a club last year:


Some people indicated that they got some swag like a disc or clothing when they joined the club, and those costs were a bit higher than the rest. Other people indicated that they could (or have in the past) buy a lifetime membership. Naturally, those would cost more than a yearly fee. The average cost to join a club is around $15, which is right where our club is at.


Leagues


The next cost we wanted to look at was the price to play in weekly events run by the club. Here is what we found:

A large majority of clubs charge very little for weekly events, $10 or less. A few charge $50+ dollars per week. I would guess those are larger clubs with a lot activities to choose from. Next year it would be interesting to have people indicate approximately how many people are in their club.

Our club came in at the highest 10% for weekly costs. Since those costs are mostly optional, it doesn’t have to cost much to play. (Our doubles league has a mandatory buy-in of $5.) Where does your club fall on the chart?


Our Skill Level


Now that we have the numbers for club membership, we can check out the varying demographics to see how many are in clubs. We’ll start with skill levels. The chart below was taken from a previous blog. It shows the percentage of us in each skill level.


We can now look at the percentage of each skill level that belongs to a club.


Based on the numbers, we could conclude that belonging to a club improves one’s skill level. However, I think it is more likely that as we improve in disc golf, we are more likely to feel comfortable playing around other people and testing our abilities.

When Did We Start Playing


I thought it would be interesting to look at when we started playing and see if that affects our club membership. The people who started the most recently are less likely to belong to a club, for a variety of reasons, but what about people who started 20 years ago? Or 30 years ago? Here is the chart:


The numbers bounce around a bit, but don’t really vary a whole lot. The percentages dwindle towards the end of the chart, which was pretty much expected. Earlier we mentioned that 37% of us belong to a club. Other than the first and last year(s), there isn’t much difference from average.


Gender


The last demographic we’ll look at is gender. Since 96% indicated that we are male, we already know that the male segment of our survey will be very close to the average number of people who belong to a club. Our average as a group is 36.5% The male average is 36.3%. For those who indicated that they are female, 43.4% belong to a club. For those who did not indicate a gender, 34.5% belong to a club.


Past Years


Finally, let’s look at an earlier State of Disc Golf survey and see if there have been any changes to the percentage of us who belong to a club. Here are the results for the 2015 survey for the question, “Do you belong to a club?”


That is a significant difference in club membership from 2015 to this year. Based on the chart above that indicates the year we started playing, we can’t really blame the drop in club attendance on the pandemic and the people who started playing in the past couple of years. We might be able to blame the pandemic for people not wanting to play in a club because of social distancing fears, despite disc golf being a non-contact, outdoor sport. Perhaps in the next few years we’ll see an increase in the number of people joining clubs, which would be evidence of the effects of Covid.

Let us know in the comments about your club and leagues. Is your experience in line with the majority? Or are you an outlier?

Tune in next week when we’ll look at more survey results.

State of Disc Golf: Aces!

It won’t come as a surprise to anyone to hear that the people I know who play the most (or have been playing the longest) have the most hole-in-ones, or ‘aces’. Most of them can tell you exactly how many aces they have. Some retire and save their ace discs, while others continue to throw them, often times picking up multiple aces on the same disc. I frequently see pictures of found discs that have aces or multiple aces, so I know a lot of us continue to throw them. Others of us have few or no aces, always hoping to add a hole-in-one to our scorecards.

Because of the size of the target we are aiming for in disc golf, we get a lot more aces than our sister sport, ball golf. Even so, our first ace often takes years to accomplish. I talked to one disc golfer a few years ago who had a PDGA number that indicated he had been playing since the 80’s, yet he didn’t have a single ace! The often elusive ace is what we are going to be talking about in today’s installment of the State of Disc Golf 2022.

Did We Ace?


In our survey for last year, we asked a couple of questions about aces. First, we asked if you got an ace in 2021. Second, if you did get an ace, we asked how many aces you got. We’ll look at those answers, as well as a breaking down the aces by a few different demographics.


Checking out the survey results, we see that over a third of us indicated that we got an ace last year.


Multiple Aces


After we established how many of us got an ace, we asked those people how many aces they got last year. Which is kind of disgusting to those of us who didn’t get an ace. But, as painful as it might be, we wanted to know how many aces people got. It turns out that some of us get a lot!


Almost all of the people who aced last year got five or less. But, there were quite a few who got between 6-20 aces. And there were a select few who averaged a couple aces per month! If you play a lot and have some short courses near you, it would certainly increase the odds of getting aces.


Play More, Ace More


Speaking of playing a lot, I wanted to isolate the people who aced last year, and see how many rounds they played. Obviously, the more you play, the more opportunities you have to ace. I took the people who indicated that they aced last year, and sorted them by the number of rounds that they average each month. Since there were a range of the number of rounds played, I just took the low of 1-5 rounds, and the highest two ranges, 25-30 rounds and 30+ rounds. Here are the stats:


Want more aces? Play more rounds of disc golf!


Skillful Aces


Another demographic I wanted to examine is the skill level of the people getting aces. Again, it is pretty obvious to predict that the higher the skill level, the more aces. The interesting part might be to look at how many more aces an average pro will get, versus an average beginner. Here is a chart showing the percentage of each skill level that got at least one ace.


Him, Her, Them


When it comes to a comparison between men and women, it is another example of knowing the results, but not knowing the margin of difference. Men can throw farther on average which gives them an advantage of being able to reach more holes, thus giving them more opportunities for aces. Here are the numbers:


Around 20% of the women who took the survey got an ace. With the guys, over a third of them got an ace. The sample size for the men is significantly larger than for the women or N/A, so it is likely more accurate.


Past Ace Data


One last piece of ace-related data that I wanted to look at is to check with the results of the 2018 survey and compare the aces rate from then to now. My first thought is that there wouldn’t be a big change from year to year for the percentage of us who get an ace. Then I looked at the numbers:


I was surprised to see a significant difference in the number of us that picked up an ace in 2018 over 2021. There were 44.2% of us that got an ace in 2018, but only 36% of us aced last year. To figure out why we dropped in numbers last year, I looked at some of the survey results shown above.

The first thing I looked at was the number of rounds played in 2018 to see if there were numbers that would point to something significant. It turns out that number of rounds played were done so at a nearly identical rate in 2018 and 2021. However, the percentage of people getting aces were lower in 2021 for every category of rounds played. That made me think that skill level was to blame.


Pandemic Affect


One of the byproducts of the pandemic was a huge influx of new disc golfers. The survey results affirmed that fact. Here is the breakdown by skill level of survey respondents in 2018 and 2021:


Clearly the upper divisions have shrunk slightly and the lower divisions have grown a bit. That seemed to validate my theory that we have a smaller ratio of people in the higher division, leading to a smaller ratio of people getting aces. However, when I looked at the percentage of aces in each division, each division is lower in 2021 than it was in 2018.


I still think the lower ace percentages are affected by the growth that came about because of Covid. I suspect there are more people in the sport which might lead to people moving up divisions earlier than they should. Perhaps next year’s Survey will shed more light on the lower ace numbers.

Check back next week for more survey results!


State of Disc Golf: Brands in Our Bags

There was a time early in my disc golf ‘career’ that I threw only one brand. It was a conscious decision and every disc I threw was an Innova disc. Eventually, I started adding other brands to my bag, and it became much more diverse. As I starting throwing more Infinite molds I really liked the feel of the I-Blend plastic, as well as the S-Blend, and started replacing my go-to molds with Infinite molds. From then on, I started throw any brand on the market. The majority of the brands in my bag are Innova and Infinite, but I also have discs from many other companies, including Elevation Disc Golf and Thought Space Athletics. I like it that way.

From what I see in disc golf, most of us throw a variety of brands, even if we have a favorite. It is fun and interesting to throw discs that are new to us, and fun to try new plastic types.  Even though most discs we experiment with won’t make it into our bags, some do. And some make a difference in our confidence and our game. Our choices of regular throwers is what this week’s blog is about.

Brands We Throw

In this blog we will look at the State of Disc Golf Survey to find out about the brands we throw. We will check out a few factors that might affect which brands we throw. We will also look at the brands we know about. Let’s get to the survey results.

Since most of us throw a mixed bag, in order to find out which brands are bagged the most we asked simply, “Which of the following brands are included in your bag?” Our checklist included all of the big brands, most of the smaller brands, and even some tiny brands with only a few molds. Survey participants could also write in any other brands we didn’t include. Here is a graph of the results:


You could probably have guessed which brands would land in the top two spots. Innova, the perennial champion, and Discraft, home to arguably the best MPO and FPO players on the planet. As we’ll see shortly, Discraft doesn’t always fill the runner-up spot. But they are always in the mix. And they are followed by many of the ‘usual suspects’. Let’s see the order of popularity of the top brands in 2018:

Innova has a surprisingly similar percentage of us who bagged their brand in 2018. They still had the lead with 81.2% of us carrying their brand, versus 82.8% of us bagging Innova last year. Dynamic Discs held the second place spot, with Discraft rounding out the podium. The jump in numbers that Discraft made from 2018 to last year could very well be attributed to the aforementioned GOATS, and some new molds. And the jump was supported by a couple of staple molds, the Buzzz and Zone.

I pulled up a graph of the 2015 results of the same survey question. The top brands look similar to this year’s survey results. Some of the smaller brands percentages have changed a lot. Vibram, who stopped making discs in 2018, was in 16.7% of our bags in 2015. Last year only 3.7% of us still bagged the rubber discs. (Just last year Vibram started releasing some of their older molds in a new rubber blend.)

Brands Thrown By Pro/Am’s

I wanted to use the data we have to see if there was a difference in bagged brands between skills levels. I took the least-experienced players, Beginner/Recreational disc golfers, and compared them with Professionals. I don’t know how many of the professional players are sponsored, thus limiting their choice of brand (except Infinite Discs sponsored players who, can throw any brand!), but it is probably a small amount of survey respondents. Here are the graphs of the top 15 brands

Naturally, the top two spots for each skill level are the same for each skill level. After that, the brands and percentages vary. It appears that the pros throw fewer different brands than beginners. That is probably less about sponsorships and more about only throwing a few molds, and having multiples of those molds.

Top Selling Brands at Infinite

To give you a comparison of what brands are in your bag versus which brands we sell the most, here is a graph showing the breakdown by brand of all the discs we sold last year. Keep in mind that Covid affected those numbers. Even so, the leaders are still the biggest, oldest brands in the business. With a few exceptions.

Brand Familiarity

We are always curious how many people are familiar with certain brands, particularly the smaller ones. This has never been truer than the last couple of years. With so many new brands and molds coming to the market, it has been hard even for us to keep track of all of them. In the survey we asked how familiar you are with the brands on our list. Survey participants could rank their familiarity from 1 (‘Not Aware of Them’), to 5 (‘Regularly Follow Them’). Here are the results, sorted by brand familiarity.

Single Brands In Our Bags

At one end of the mixed-bag extreme, we had people who indicated that they have over 30 different brands in their bag. That sounds like an intentional choice, but since there is great plastic and molds from tons of manufacturers, someone could make that their goal and still have many discs to choose from.

At the other end of the spectrum are the people who, like I used to be, only throw one brand. I wanted to see how many of those people there are, and what single brand they throw. So, I ran the numbers and here is what I learned.

Of the 7709 people who took the survey, 261 of us have single-brand bags. That is just over 3% of us who are loyal to one brand. Here is a chart showing the brand name, and the number of us who bag only that brand. While the top two brands will surprise no one, it’s kind of nice to see some of the smaller brands have such loyal fans.

An extra shout-out to the handful of people who bag only Infinite Discs!

Tune in next week when we’ll feature more results from the State of Disc Golf survey.


Most Important Factors for Selecting a Disc: Weight, Flight Ratings, Color


Choosing the Right Disc: What to Consider

When it comes to buying a disc, there are many factors we might consider in making our decision about which disc to choose. I think that most of us have established our hierarchy of disc needs that we weigh against the options available.

Flight numbers, for better or worse, and weight are definitely high on my list of requirements. There are many molds and weights that are outside my set parameters and I would never buy one of those discs. Plastic type is only slightly behind weight and flight in importance, and sometimes I have some flexibility in what I will buy – assuming that my top preference is not available.

Following those three factors, my hierarchy becomes less about needs, and more about desires.

Although I will throw any brand, I have a lot of Infinite molds in my bag because I like the molds and plastics. And I will also throw any color disc, but if I have a choice I will pick bright pink. Pink is the best color when you end up searching for a lost disc in bushes, trees, or long grass. (I love the look of a black disc, but HATE looking for a black disc in bushes!) Collectability, resale value, and the stamp are all important factors in certain circumstances. But, for a thrower those things are near the bottom of my list.

Factors in Choosing Discs

All of the factors mentioned above are what we asked about in the State of Disc Golf survey. This week we will look at what we consider important factors in disc selection. We will also look at a couple of subsets of survey participants and which factors are important for them. Let’s start with the three things that I place at the top of my preference list: flight numbers, weight, and plastic type.

We have established in previous survey blogs that although some of us buy discs to collect and not throw, most of us are going to play with the discs we buy. Since that is the reason we are buying most of our discs, the factors affecting the flight will be the most important things to consider. Here are the results of the survey question asking about the importance of those factors. We gave four options to select, ranging from ‘Don’t care at all’ to ‘Very important’.

Flight Numbers

Nearly 90% of disc golfers consider the flight numbers of the disc as an important factor. 59.1% consider flight numbers very important while 29.6% feel the flight numbers are semi-important.

Graph showing that 59% of disc golfers consider flight numbers very important.

Disc Weight

To more than 90% of disc golfers the weight of the disc is an important factor when selecting what to buy. While flight numbers are very important to the majority, weight is not rated “very important” quite as often.

Graph Showing percentage of disc golfers who consider the weight of the disc as important.

Plastic Type

Disc golf is full of different plastic blends and varieties. Players develop preferences, and the plastic type of the disc is important to 96% of disc golfers. My guess is that the plastic preferences don’t variate much between premium plastics, but do vary substantially between a disc mold when comparing a base and a premium disc mold.

Bar graph showing survey results of how important plastic type is when choosing discs. 96% say plastic type is important.

Our Disc Choices

It is interesting to see that more people chose plastic type as being Very Important than chose flight numbers or weight. Regardless, around 90% of us consider those three factors as being at least semi-important. I would expect at least that amount, and maybe more. Let’s look at a few more factors.

Less Important Disc Selection Factors

Beyond the flight of the disc we might consider its aesthetics when looking for a disc to buy. Finding a color that is appealing, or utilitarian, as well as a stamp that we like can be as difficult as finding the right flight numbers and weight. Even more so if we prefer a specific brand of disc. Here are the survey results showing the importance we place on those three factors.

Disc Color

The color of the disc is important, but more than 32% of disc golfers don’t consider the disc color as important while only 22.6% of disc golfers surveyed consider color to be very important.

Bar graph showing percentage of disc golfers that consider color important.

Disc Golf Brand

There are many brand loyalists in disc golf, especially for sponsored players. Over 70% of disc golfers consider the brand of the disc as an important factor when selecting their next frisbee to buy.

Importance of disc brand bar graph

Disc Stamp & Stamp Artwork

While having a good looking disc with a nice stamp and artwork is awesome, just a little over half of surveyed disc golfers consider the stamp artwork as important with only 14.2% of disc golfers saying that the disc stamp is very important.

Graph showing percentage of disc golfers who consider the disc stamp artwork as important.

Once again, if we consider the percentage of us who think that those factors are semi-important to very important, we see that brand and color are hovering around the 70% mark. The stamp/ artwork factor drops off a bit from the other two categories, coming in near the 54% mark. All things considered, most of us would take an amazing, good-looking stamp over a boring stamp. But, little more than half of us make that a priority. Disc color and brand are a bit higher.

Buying Discs for Collectability and Resale Value

The final two factors to look at when buying a disc are beyond the throwers that most of us are looking for. Buying a disc for its collectability, or rarity, is something that few of us think about. Resale value is important to even fewer of us. While there are many in our sport who buy a rare disc to immediately flip it for a profit, most of us don’t make purchases for that reason. Even the one in five of us who buys a discs for its collectability does so without the thought of resale value about half of the time. Here are the numbers:

Percent of disc golfers that buy discs to collect Graph showing that most disc golfers do not care about the resale value of the discs they buy.

Skill Affecting Decisions

What factors are most important to beginners, intermediate players and professional disc golfers?

Jumping back to the top three factors that most of us consider when buying a disc (Weight, Flight Numbers, and Plastic Type), I wanted to see how our skill level impacts the importance we place on those characteristics. Let’s compare the numbers of beginner/intermediates with professionals. Here is the data:

Although both skill levels give the Weight of a disc nearly the same level of importance, there is a bit of difference when it comes to Flight Numbers and Plastic Type. Looking at what those two skill levels consider are the most important characteristics, we see that professionals care a significant amount more about plastic type than beginners. And beginners care about the same amount more than pros do about Flight Numbers.

Our Flight Rating System

Ahhh, flight numbers. Many disparaging remarks have been made about our current 4-number flight rating system. As flawed as it may be, many of us still rely on it for information about a particular mold. As people first get into disc golf they learn about the flight rating we use, and rely on it heavily. That would explain the higher number of beginners who value the Flight Numbers.

As people get more experience in the sport, I suspect they rely on other methods of determining which disc will be useful to them. Talking to other experienced players, and seeing what other people on their level are throwing would be more accurate to them than the flight numbers. They likely also develop more of a feel for what they want to throw, which would explain the higher value placed on the Plastic Type by pros over less experienced players.

Collectors – How Many Discs do They Buy

One other subset of the general population that I wanted to look as is the avid collectors. For this blog we will look at the 344 people who said they bought more than 40 discs that they will collect and not throw. I wanted to see what value they place on Stamp/Artwork and Resale Value. Let’s see what the survey says:

Disc golf collectors care about disc art graph Graph showing importance of resale value

It’s not surprising to see a higher percentage of people who collect discs make Stamps and Resale Value a higher priority. Speaking from experience, there are some discs I want to add to my collection regardless of the stamp. Other discs I want exclusively because of the stamp. The Nicola Tesla stamp is a good example of that. Plus, I think that most of us like the idea of having discs in our collection that enough people want that gives us the option of selling it down the road for a tidy sum. That’s just a little more of a priority for collectors.

Comment Below

Comment below and let us know which of these survey results surprised you the most, and which was completely expected. Then check back next week for more survey results!


1 2 3 4 14